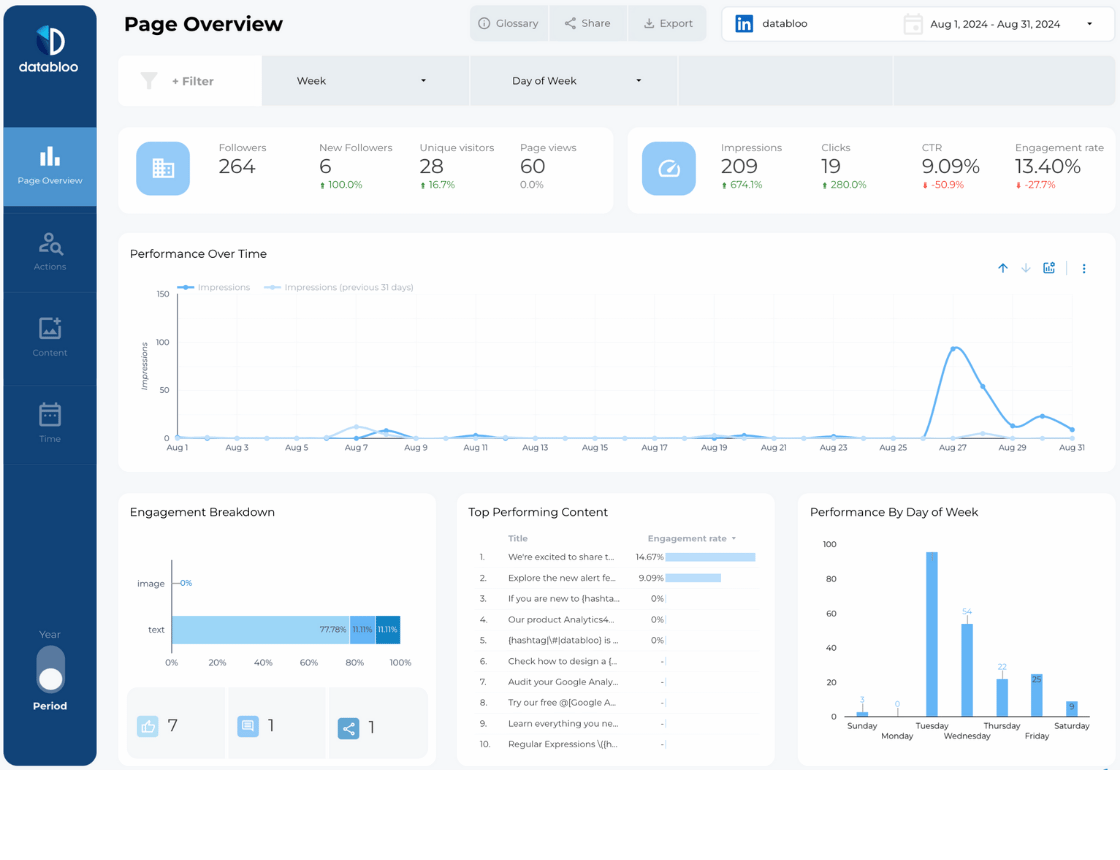
Why Do You Need a Social Media Dashboard?
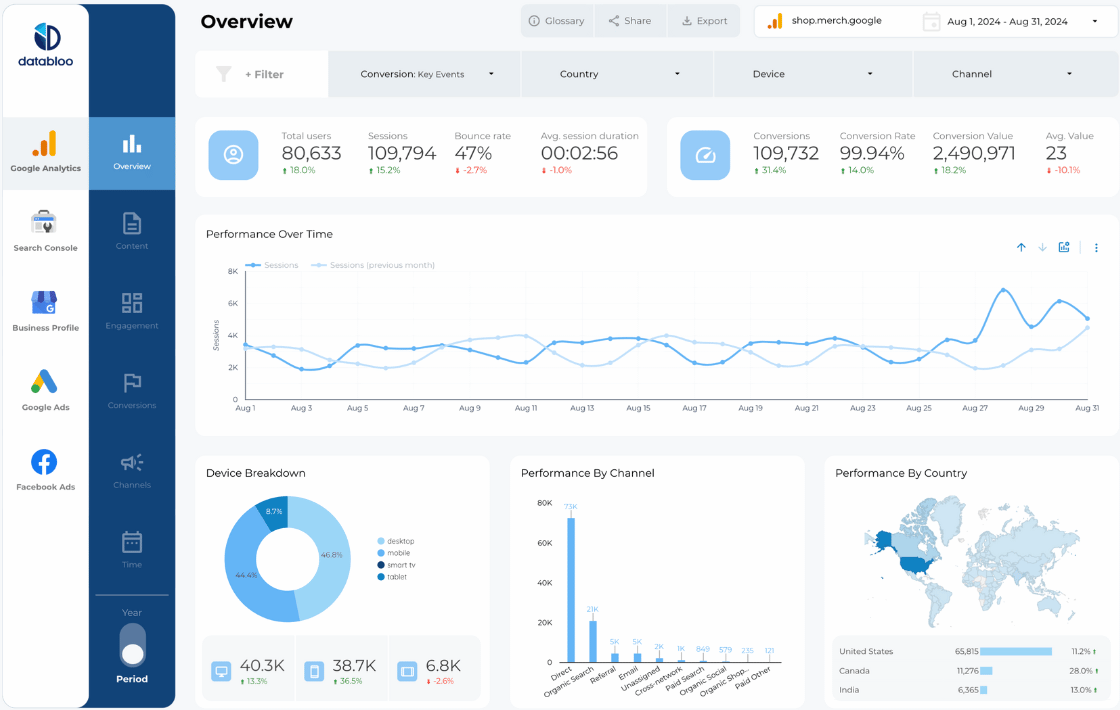
A social media dashboard is an essential tool for any digital marketer or business owner striving to optimize their online presence. Bring together data from various social media platforms into one intuitive interface to obtain real-time insights and analytics about your brand performance on social platforms.
A well-configured social media dashboard is particularly useful for answering key questions like:
- What are my best performing and worst performing social media channels?
- What should I do to increase my audience and its engagement?
- Which types of content (images, videos, blog posts) are receiving the most engagement on each channel?
- How does the engagement vary between organic and paid content?
- What are the peak times for user engagement on each of my social media channels?
- Which demographic segments (age, gender, location) are most active on my channels?
- How effective are your current hashtag strategies in increasing reach and engagement?
- What type of user-generated content about my brand is most popular?
- How does my audience interact differently with short-form vs. long-form content?
Let’s start with setting up your social media dashboard reports.
Set Up Your Social Media Dashboard
The easiest way to set up a social media report is to use Google Looker Studio (Data Studio) template.
Templates will help you connect your social media data streams and present data in the most convenient actionable way.
Decide On Your Main Social Media Channels
You can target all and count your overall views on all platforms, but typically such insights don’t bring much value.
For maximum actionable insights, it’s best to combine general social media data with unique data points for every social media platform you target.
Youtube
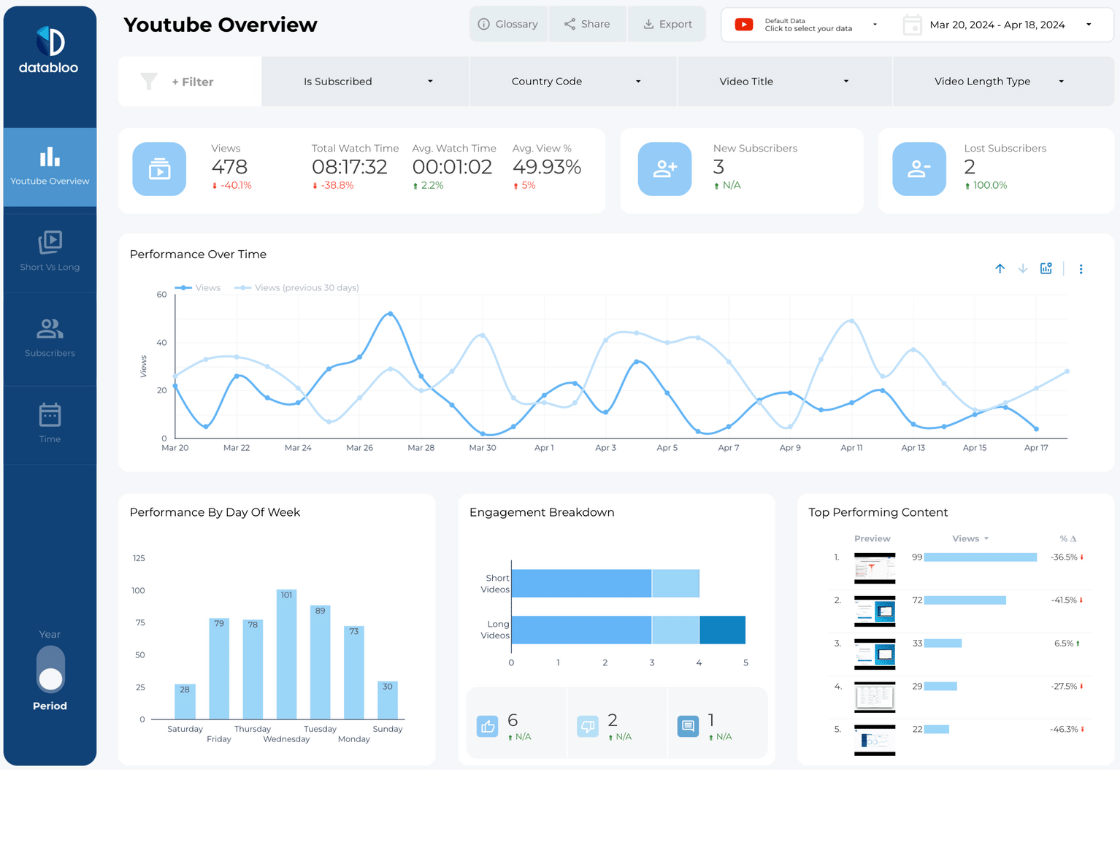
The social media dashboard that focuses on Youtube channel performance will help you answer the following questions:
- What video formats perform best on my channel?
- How does viewer engagement vary across different videos? This question focuses on understanding the variation in likes, comments, and shares across different videos. It helps in identifying what specific content triggers more audience interaction.
- Which videos are most effective in retaining viewers till the end? This addresses audience retention rates for each video. High retention rates are often a sign of compelling content that keeps viewers engaged throughout.
- What are the demographic profiles of my viewers? Understanding the age, gender, location, and interests of the audience is crucial for tailoring content and marketing strategies.
- How do external sources and traffic from other platforms affect my views? This question explores the role of external sources in driving traffic to the channel, such as social media shares or website embeds.
- What is the impact of my posting schedule on viewer engagement? Analyzing how engagement varies with the day and time of posting can help in optimizing the content release schedule for maximum impact.
Channel Growth
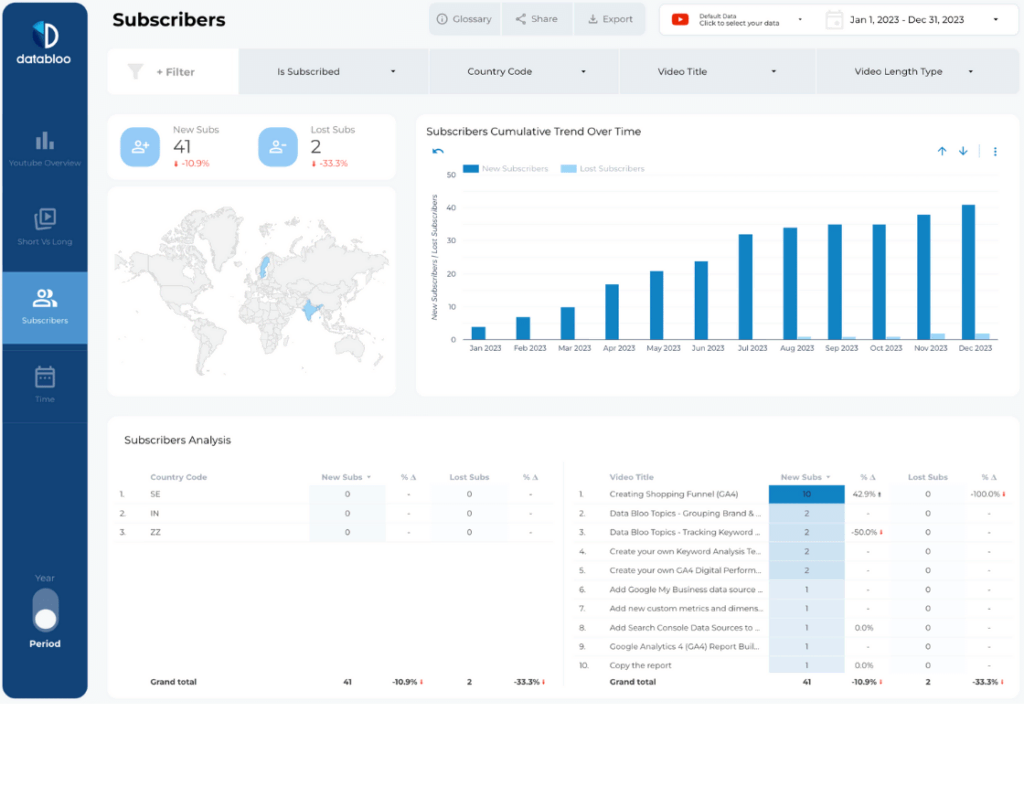
- Views and Total Watch Time. This metric is now more prioritized over subscriber count due to recent YouTube algorithm changes. It helps in understanding the actual engagement and interest of viewers in your content.
For instance, a high watch time indicates that viewers are not only clicking on your videos but also watching them for longer durations. - New Subscribers vs Lost Subscribers. Although subscriber count may not be the primary focus (as total channel views), tracking the net subscriber gain or loss is still valuable for measuring audience engagement and loyalty.
For example, a high number of lost subscribers could indicate a disconnect between your content and your audience’s expectations.
Performance By Video Type
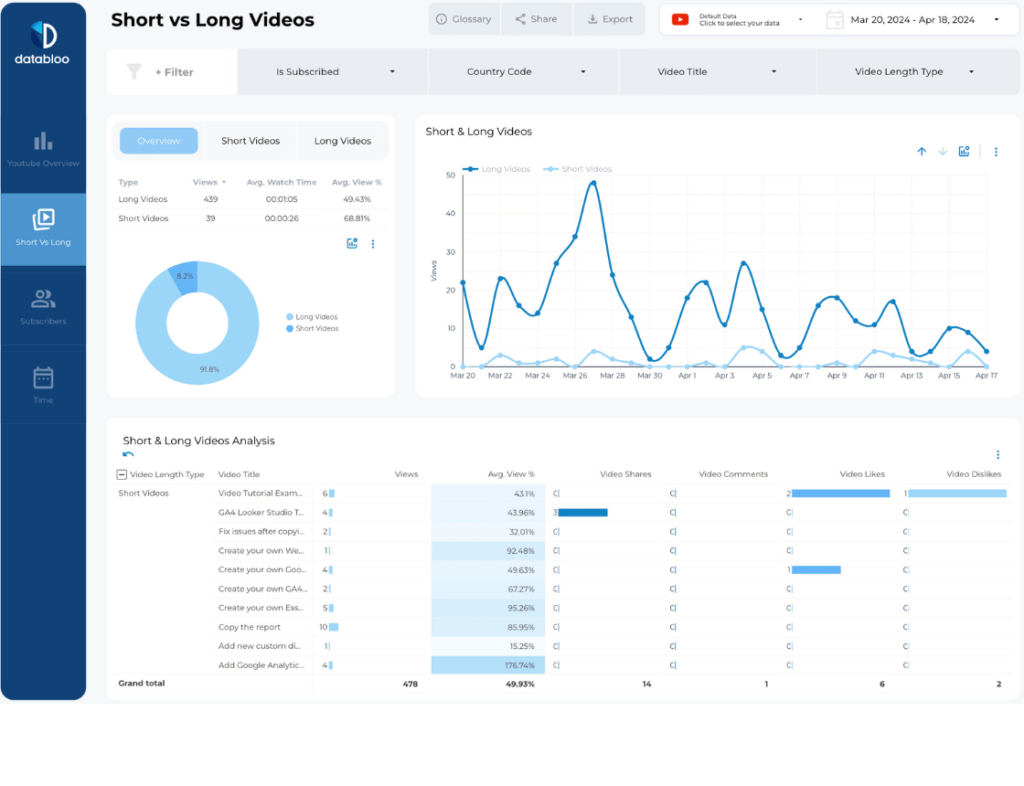
- What Videos Are Performing Better. Assess whether short-form or long-form content is more effective on your channel. This analysis helps in tailoring future content to match viewer preferences.
For instance, if short-form videos have higher engagement, it might be beneficial to focus on creating more concise, impactful content. - Performance Over Multiple Metrics. Delve into specific metrics like likes, comments, average watch time, etc., for a comprehensive understanding. This detailed analysis can reveal nuanced insights, such as a particular video format that consistently garners longer watch time or higher engagement rates.
Top Videos Watched
- Most Watched Videos on Your Channel. Identify which videos have garnered the most views. This insight helps in understanding what topics or styles are most appealing to your audience.
- Best Performing Content Formats. Determine which formats (e.g., how-tos, interviews, live streams) are most effective. For example, if how-to videos consistently perform well, it suggests that your audience values educational content.
- Videos Generating Views Over a Longer Period. Some videos may have a long-lasting appeal, continually attracting viewers over time. This “evergreen” content is valuable for sustained channel growth and audience engagement.
Facebook Ads
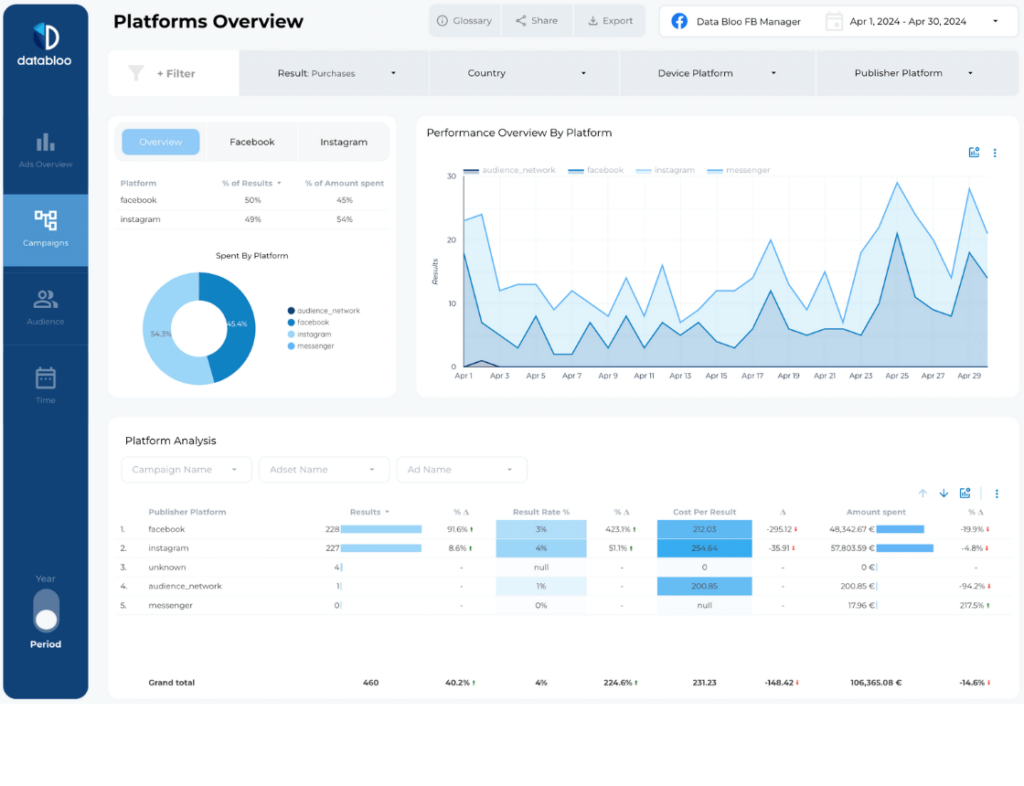
Questions Facebook social media dashboard should answer:
- What are key actions your followers prefer doing?
- What are the most liked posts in your Facebook profiles?
- How are my Facebook ads performing?
- What are the best performing formats of content on Facebook right now?
Advertisement Performance
Advertisement performance is especially useful to track ad performance and compare metrics such s cost per clicks and cost per action to other channels to determine the most optimal social media platform for running paid advertisements
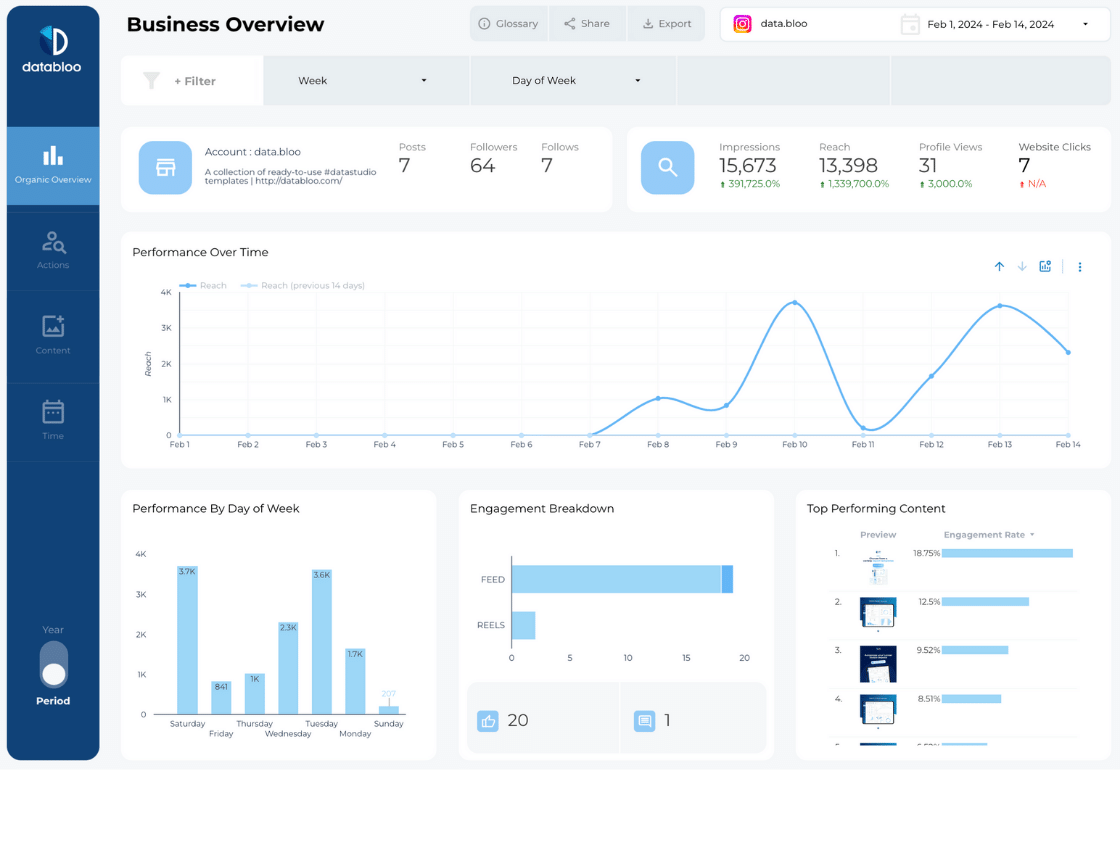
A well-designed Instagram social media dashboard help you answer the following questions using data:
- When is your audience most active on Instagram?
- Which type of content (feed, reels, posts) engages the audience most?
- What are key actions your followers prefer doing?
- What are the characteristics of the most engaging posts?
- How are follower interactions (like website clicks) distributed over time?
- What trends are evident in profile views and impressions over time?
And many more!
Audience Activity Insights
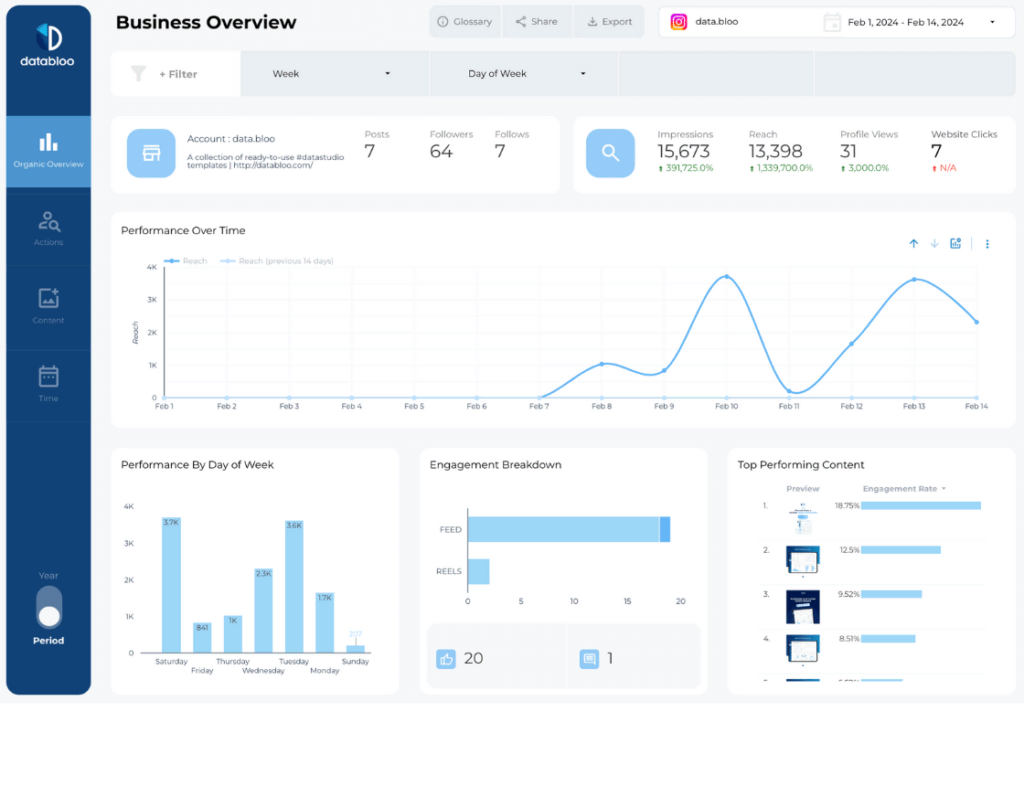
- When People View Your Account. This metric shows the times and days when your account receives the most views. For instance, if your account is most viewed on weekday evenings, you might consider scheduling important posts during these periods for maximum visibility.
- Engagement Across Media Types. Analyze how different content types perform. For example, if reels receive more engagement compared to standard posts, it may indicate that your audience prefers dynamic, short-form content.
Post Analytics
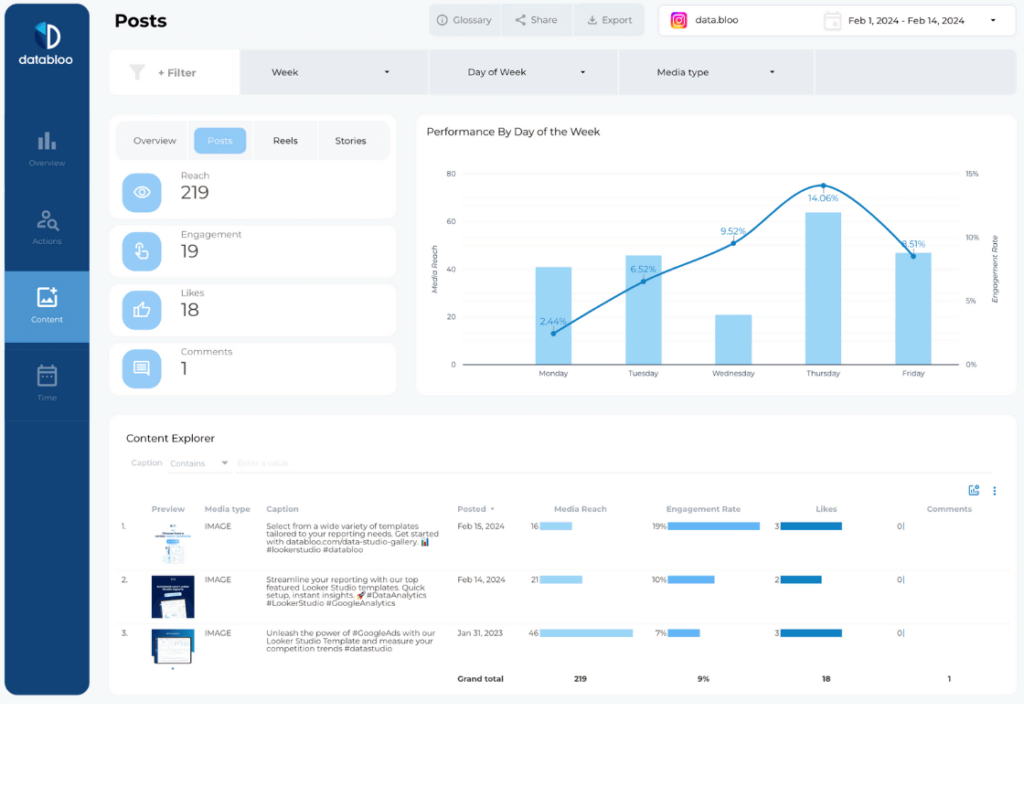
- Most Engaging Posts. Identify which posts have the highest engagement in terms of likes, comments, and shares. This helps in understanding what content resonates most with your audience. For instance, if posts with user-generated content have higher engagement, it suggests a strong community connection.
- Impressions Over Time. Track how many people see your posts over a certain period. This metric is crucial for understanding brand reach and the impact of your content strategy. A steady increase in impressions could indicate growing brand awareness.
- Profile Views. Monitor the number of times your Instagram profile has been viewed. Increasing profile views can be a strong indicator of growing interest in your brand or content.
Follower Actions
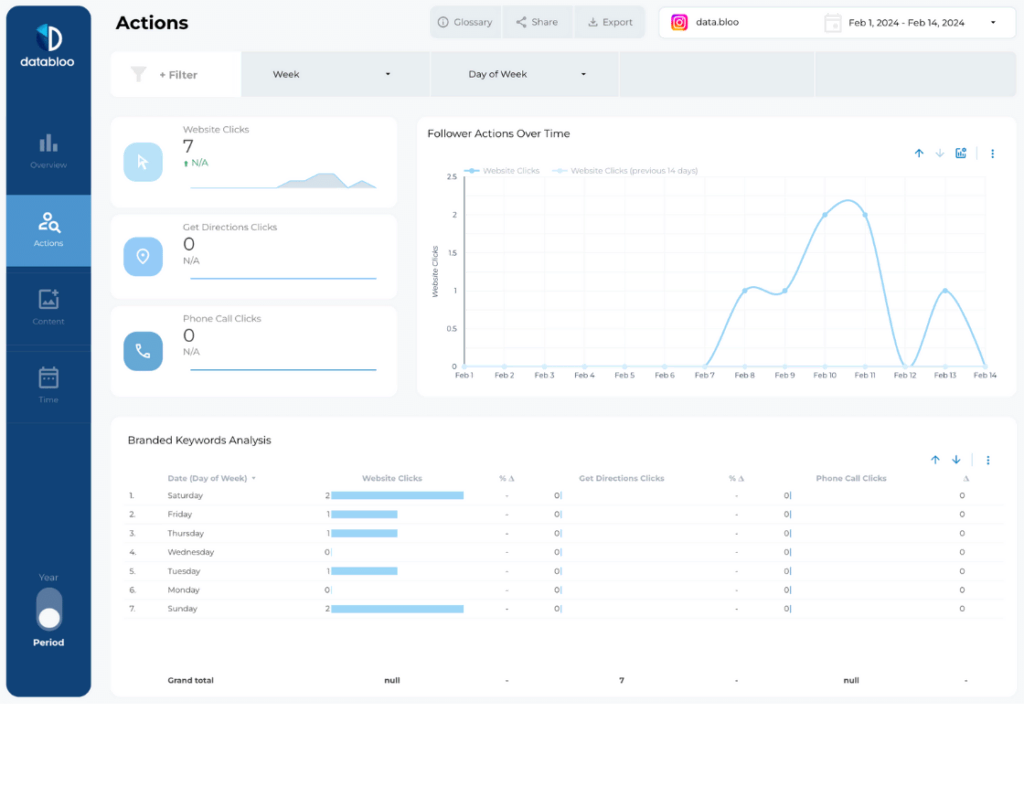
- Track Website Clicks or ‘Get Directions’ Clicks. This metric helps understand direct actions taken by followers, indicating the conversion potential of your Instagram presence. For example, an increase in website clicks following a product post can measure the effectiveness of Instagram as a conversion tool.
- Followers Actions Over Time. Analyze when your audience is most likely to take a specific action, like visiting your website or clicking on a product link. This helps in timing your calls-to-action strategically. For instance, if more actions are taken during weekend mornings, consider timing your promotional posts accordingly.

