Unlock the Power of Your Stripe Data
Are you ready to boost your e-commerce analytics? Dive into the Stripe Looker Studio Template, your key to harnessing the full potential of your payment data. Whether you’re an e-commerce owner just starting out, this template empowers you to answer crucial questions about your Stripe transactions and boost your business’s performance.
- How’s my business performing?
- What are the top revenue-generating orders?
- Who are my top and low spenders?
- What’s the reason behind declined orders?
- How are different countries contributing to sales?
- How has customer value evolved over time?
- What’s the performance of my top customers?
- What’s the risk level of my transactions?
- What’s the monthly revenue trend?
- What is the overall performance over the last 12 months?
Read More
Exploring the Sections of Our Stripe Looker Studio Reports:
Unlock the potential of your Stripe data with our advanced reporting template. Optimize your commercial strategies, increase your online revenue, and take your business to next level. Our Stripe Looker Studio dashboard includes five different sections:
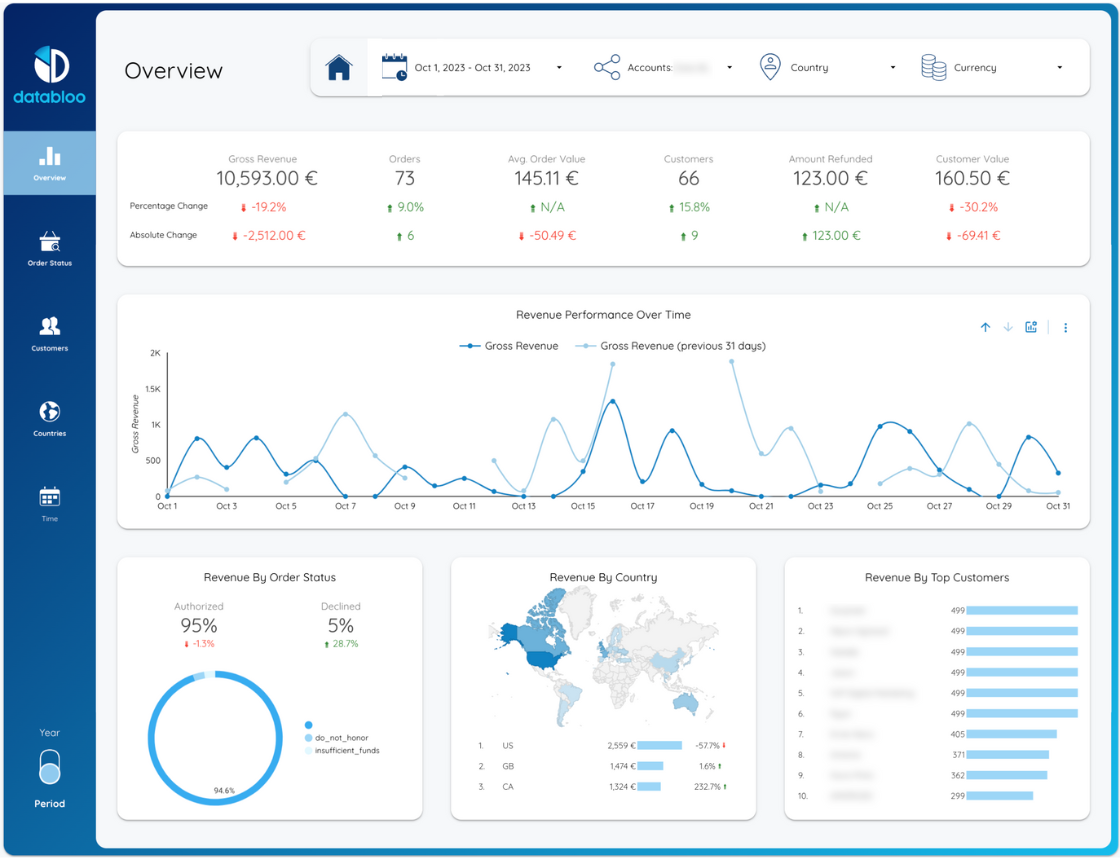
- Overview: Discover the pulse of your e-commerce business with the Overview section. In one glance, get a snapshot of your store’s performance with key metrics like Gross Revenue, Orders, Avg. Order Value, Customers, Amount Refunded, and Customer Value. Dive deeper into revenue trends over time using the dynamic time series chart. At the bottom, explore three placeholders for more insights: gain a quick understanding of Revenue by order status, view a world map showcasing revenue by country, and identify your top 10 customers with the highest order value.
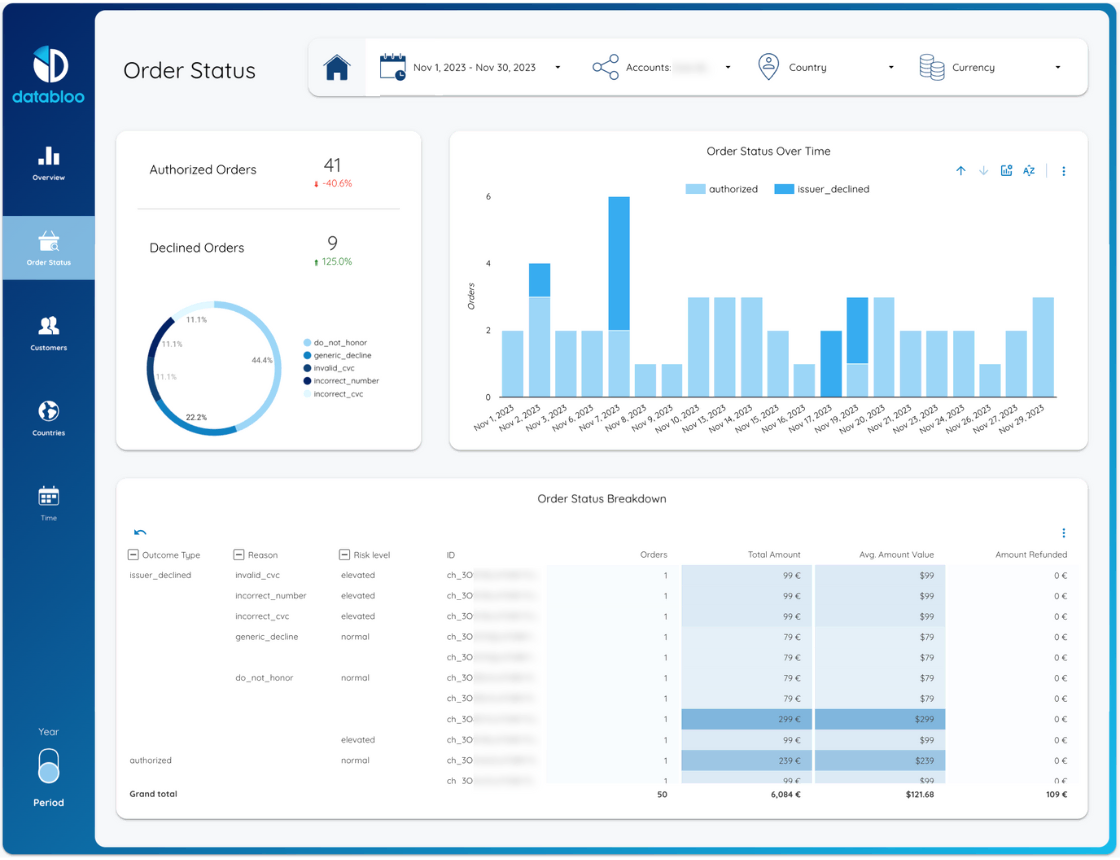
- Order Status: Uncover the status of your orders with the Order Status section. Top metrics reveal authorized and declined orders, accompanied by a donut chart detailing reasons for declines, including “do not honor,” “generic decline,” “invalid or incorrect cvc,” and “incorrect number.” Visualize order status distribution over time with an informative bar chart. Expand outcomes to gain deeper insights into declines, understanding reasons, risk levels, and Stripe IDs, all while viewing metrics like orders, total amount, avg. amount value, and amount refunded in the Order Status breakdown table.
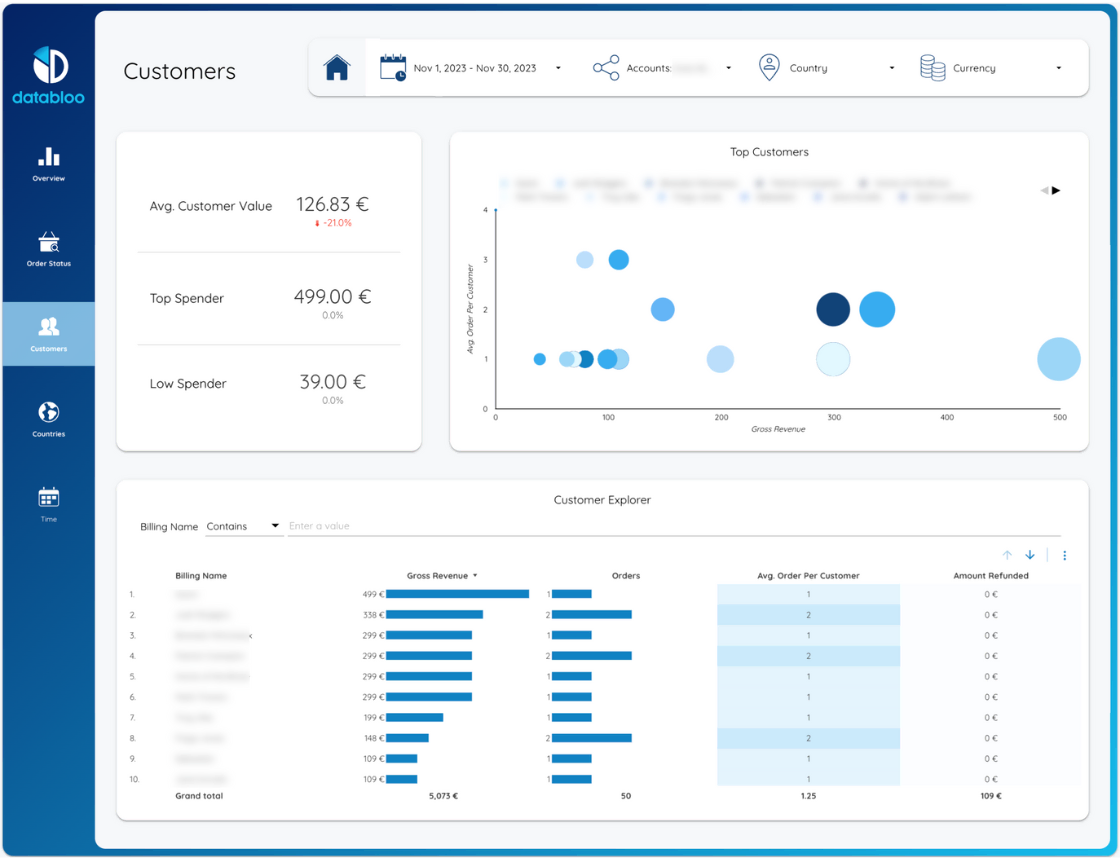
- Customers: Delve into customer behavior with the Customers section. Gain valuable insights through KPIs such as Avg. Customer Value, Top Spender, and Low Spender. A scatter chart visually represents your top customers by orders and gross revenue. For comprehensive customer analysis, explore the “Order Explorer” table, where you’ll find a wealth of information about all customers in the selected period, including gross revenue, orders, Avg. Order per Customer, and amount refunded.
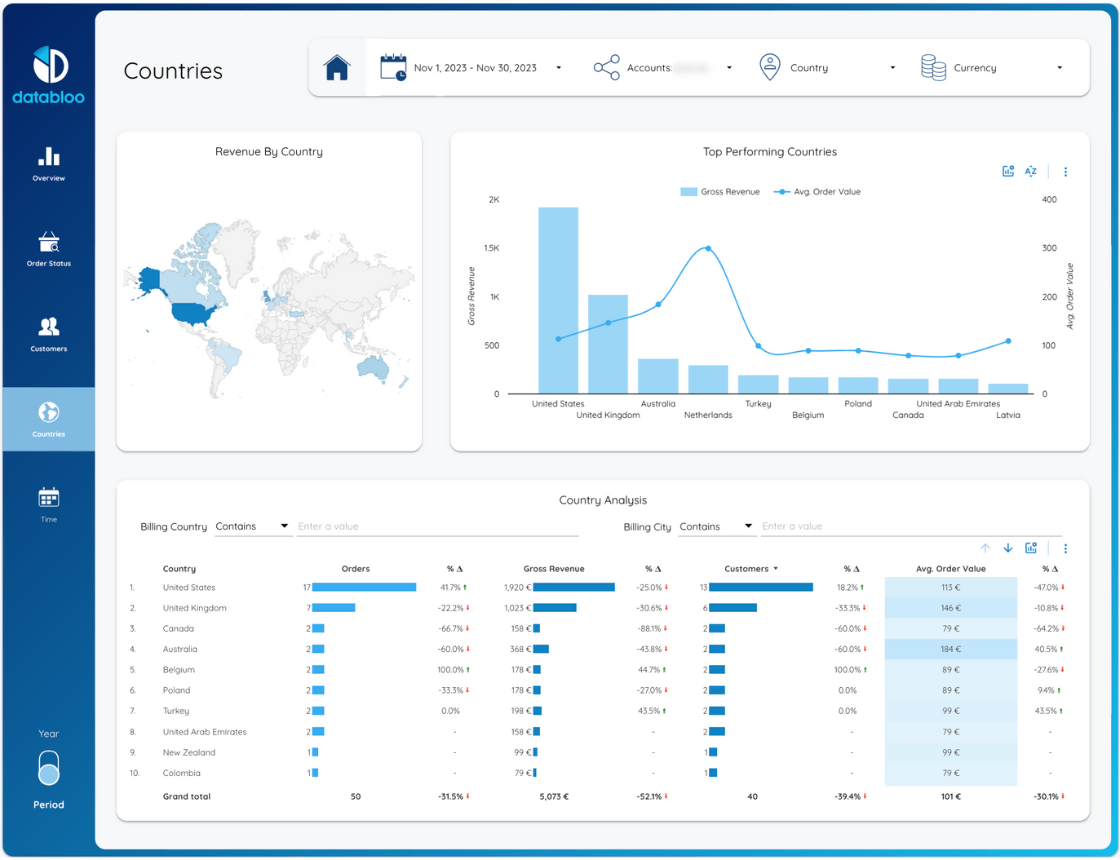
- Countries: Analyze the global performance of your e-commerce business in the Billing Country section. Begin with a world map highlighting sales across different countries. Charts display the top-performing countries, providing insights into their gross revenue and order values. Dive even deeper by drilling down into billing states and cities, all facilitated by the country analysis table.
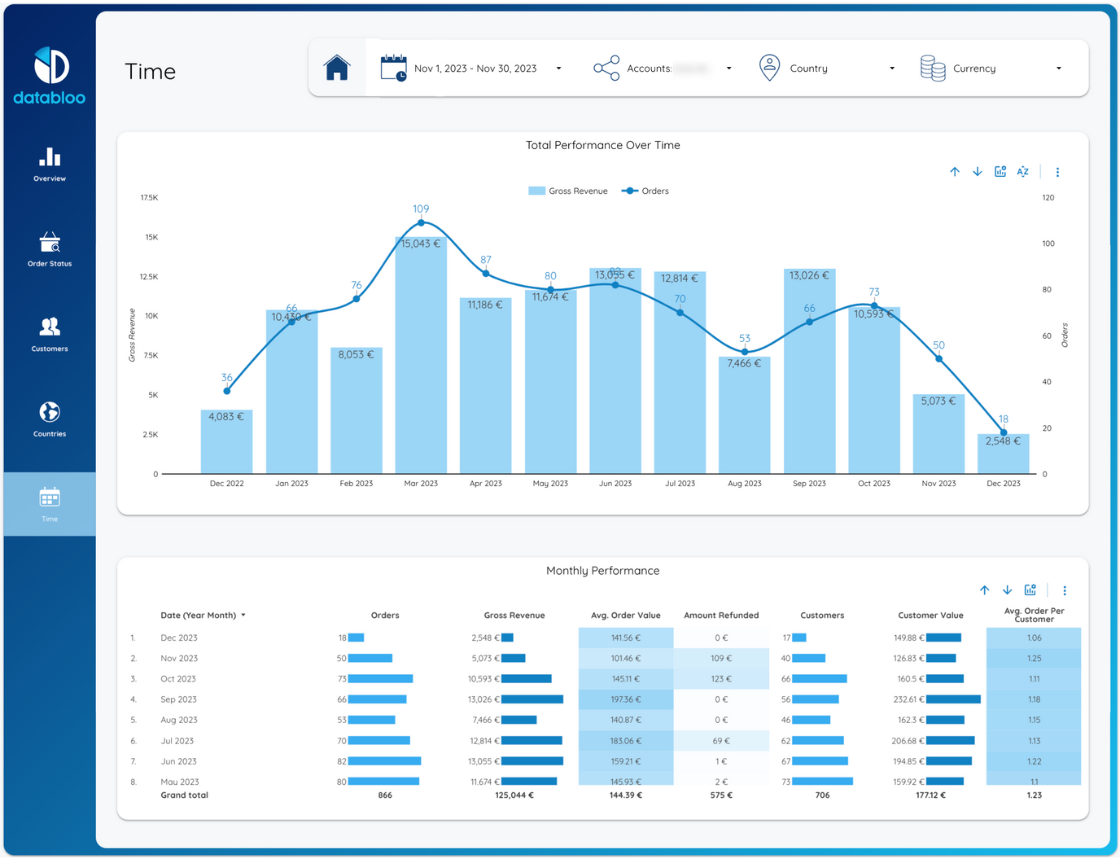
- Time: Track the historical performance of your e-commerce store over the past 12 months in the Time section. A bar chart visually showcases trends in net sales and orders. For a more granular view, drill down from month to week, allowing you to pinpoint specific trends. A comprehensive table presents monthly KPIs, giving you a detailed historical performance overview.
Free and Easy Setup
Our Stripe Data Studio Template is effortlessly accessible through a free data connector, eliminating the need for subscription fees. The setup process is streamlined, requiring just one click to get started. Unlock the advanced Stripe report you’ve been searching for and gain the insights necessary to drive your e-commerce business to new heights.


