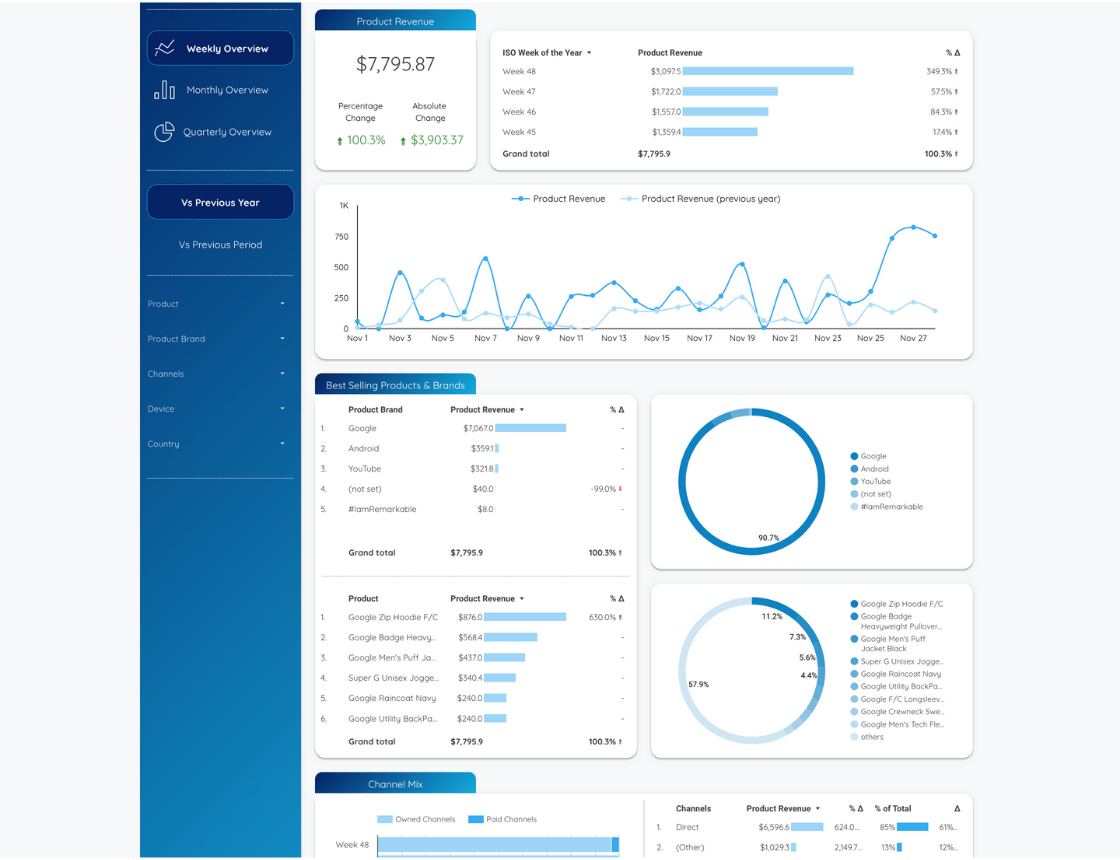
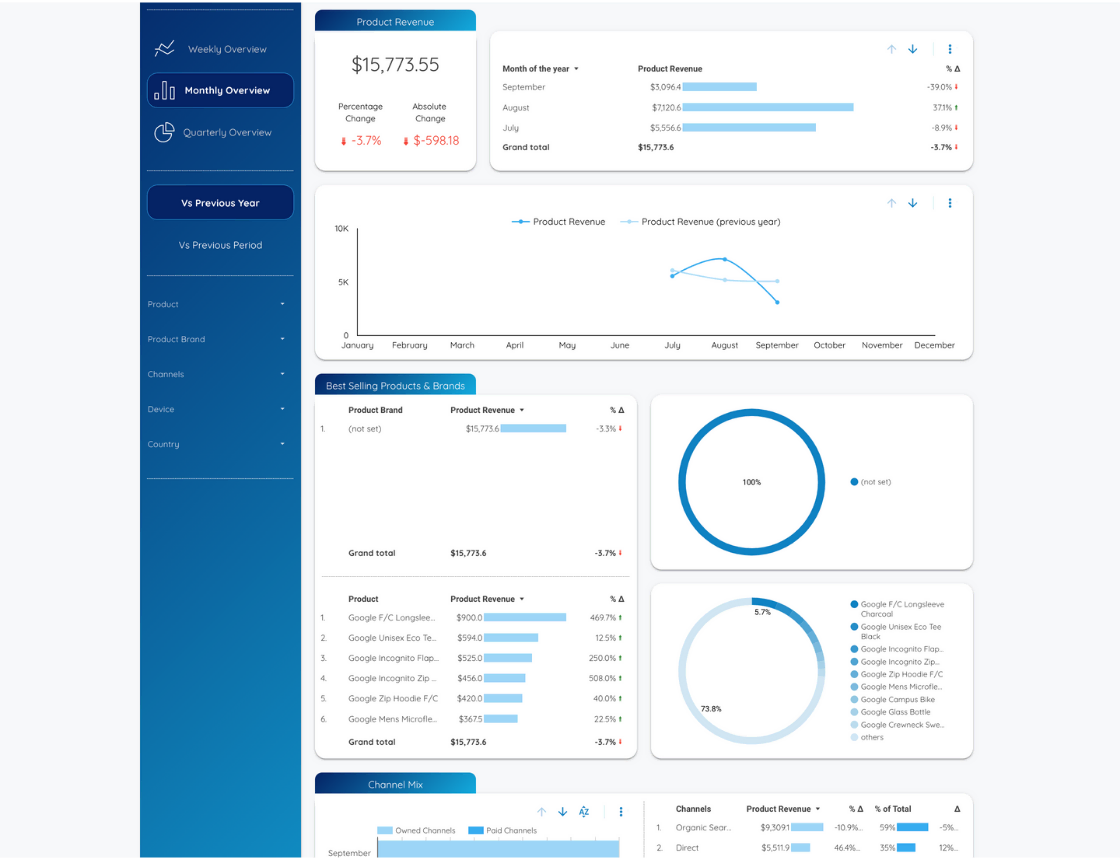
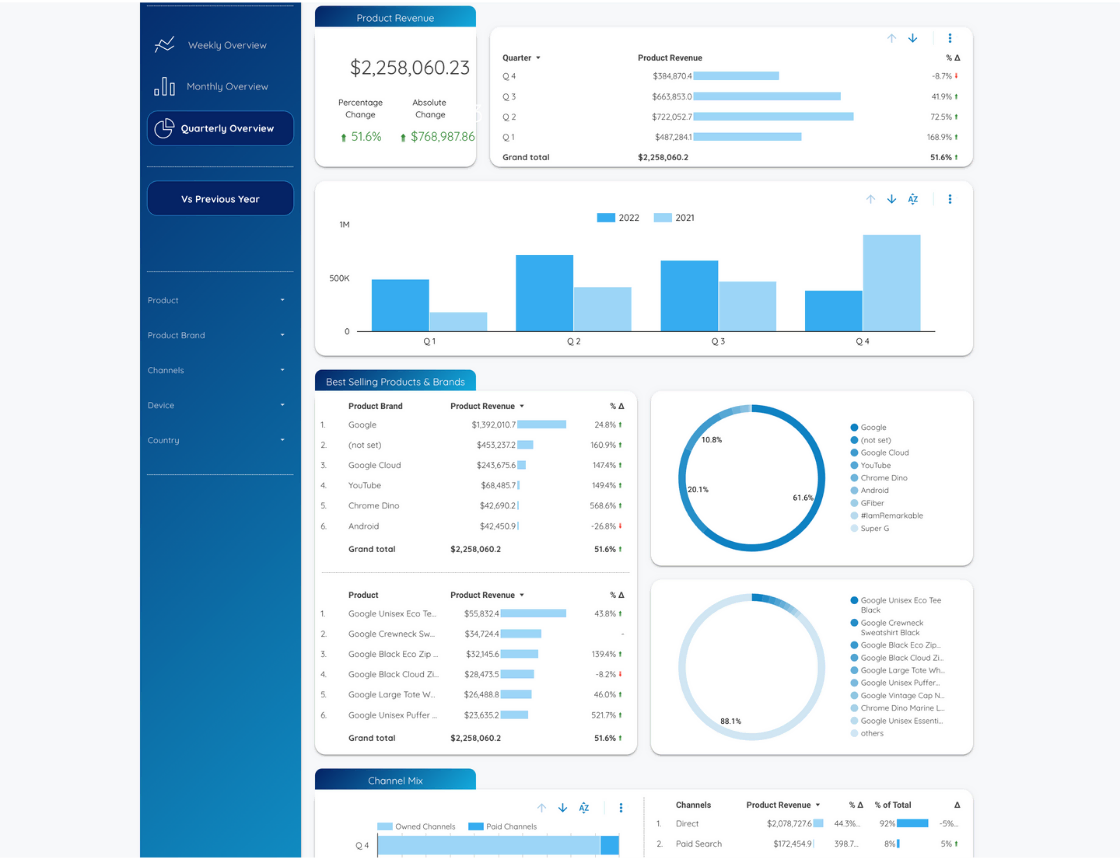
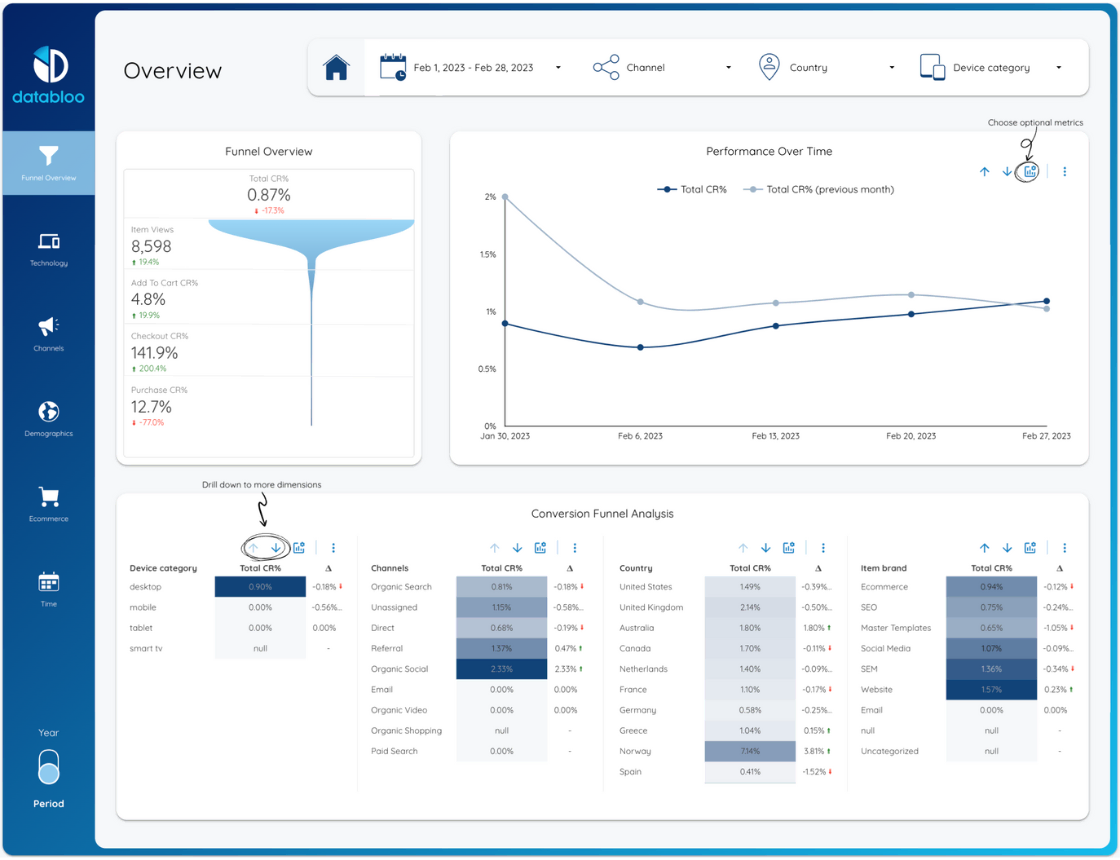
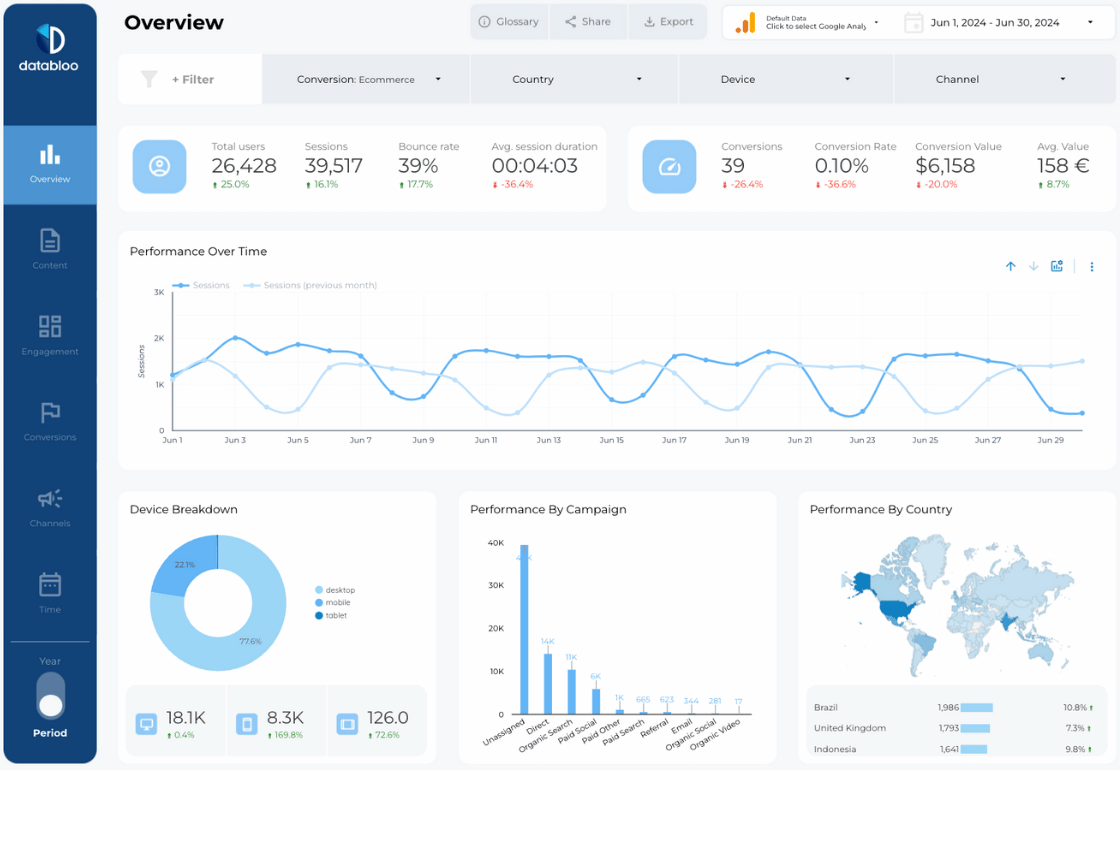
Unveil some of the pertinent information through the periodic revenue template, which includes many of the ecommerce looker studio features you’ve come to expect. The template allows you to answer questions such as:
The Periodic Revenue template provides answers to these questions and is fully customizable to your business needs.
Insights Into Specific Time Periods
As with many of the Looker Studio ecommerce reports, the Periodic Revenue also offers a dashboard segmented into tabs and radio buttons. These allow you to narrow down your revenue performance to the year, week, month, or even day.
The template has various options that change the outcome of the data. This report offers different tabs to change the information on your screen:
- Default Data: The data control allows you to choose the Google Analytics property that you’d like the information on.
- Time Period: You can choose the time period for as long as you need, and you can go back as far as the inception of the ecommerce store. You can also simplify the search result by choosing preset periods such as the last seven days, yesterday, today, this month, last month, and more.
- Set Period: These tabs allow you to scroll through set periods to gain an overview of the performance. The options are Weekly Overview, Monthly Overview, and Quarterly Overview. When you choose one of these options, it simply updates the information on the screen. You don’t go into a separate screen.
- VS Year or Period: With these buttons, you can toggle between the previous year or a specific period to compare your performance figures. For both options, you need to choose the period range that you would like to compare.
- Report Filters: This section of the template allows you to break down your performance into key factors that affect your overall sales. This allows you to drill down to the specifics of your performance metrics. You can filter the overall performance by product, brand, channels, devices, and country.
Improve Your Sales Performance
Sales performance is a key component of your bottom line. Analytics ecommerce reporting allows you to tap into the data that drives these sales. You’ll see which of your products perform best, which channels drive sales, and where your buyers are from. You’ll also see this information over different time periods. This allows you to set marketing campaigns to boost sales over busy periods, cross-sell during sales lulls, and drive products considered your money-makers.
Compatible with Both Google Analytics Versions
The Periodic Revenue Template is compatible with both Google Analytics Versions: Google Analytics 4 and Universal Analytics. Regarding the GA4, we have created two different editions, one that works with the native connector and another that uses the “Extract Data” connector, in order to overcome any quota limitations of GA4 API.


