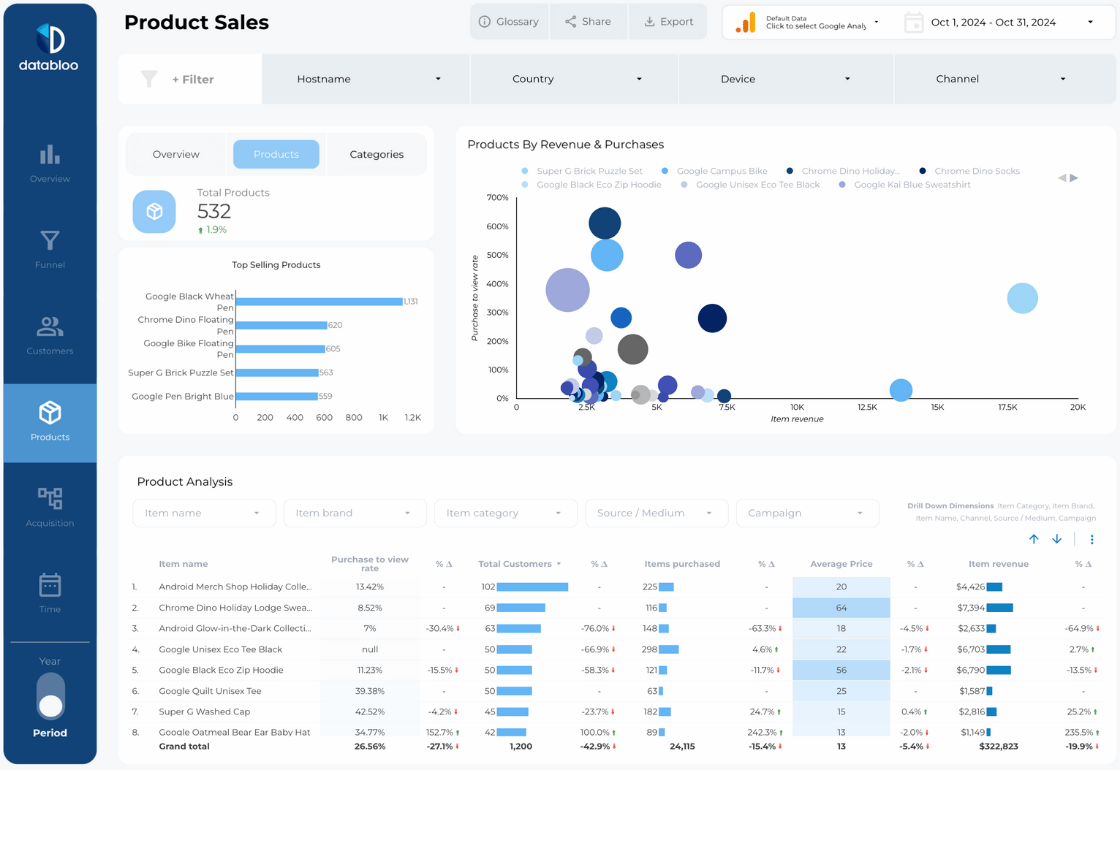
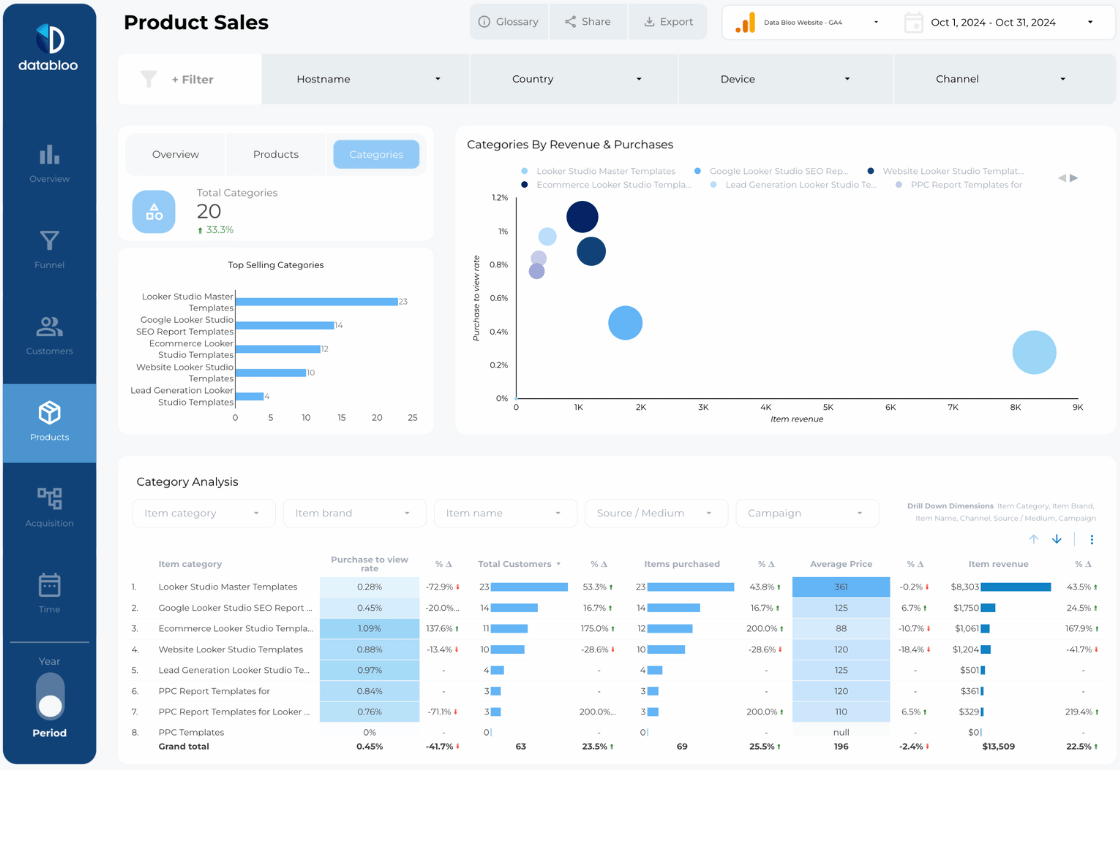
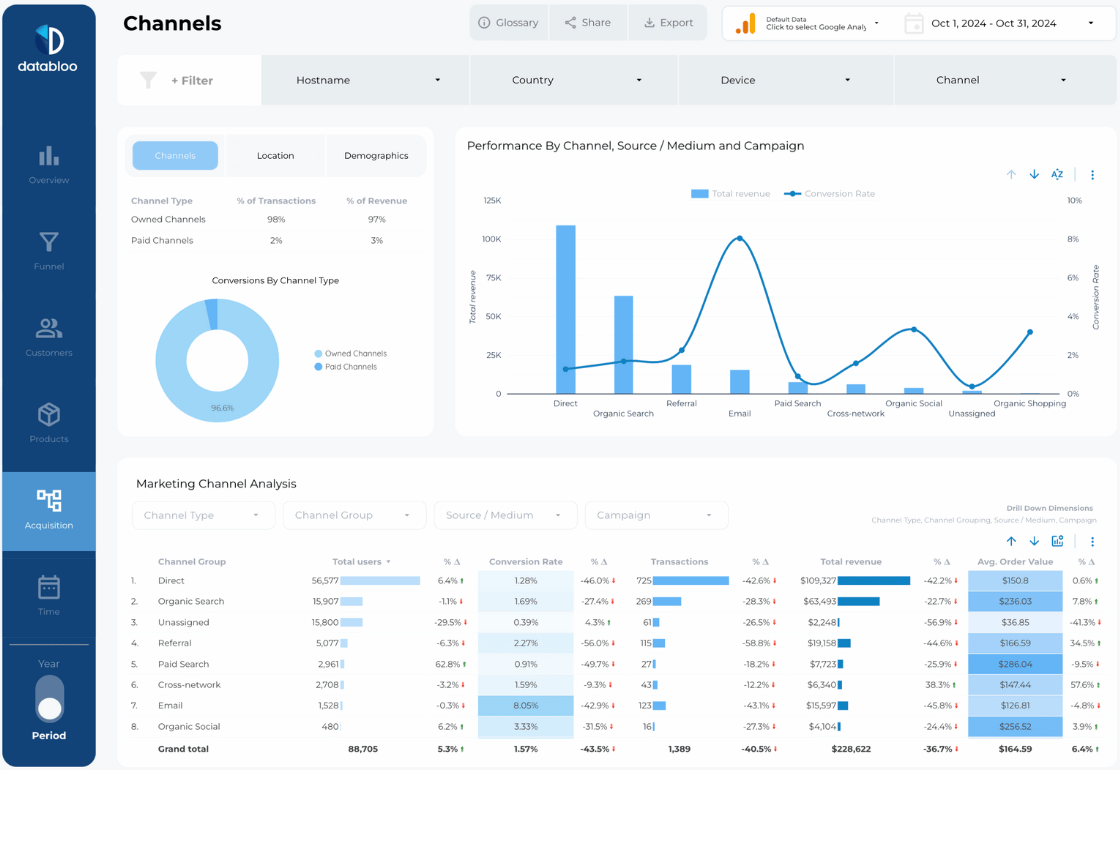
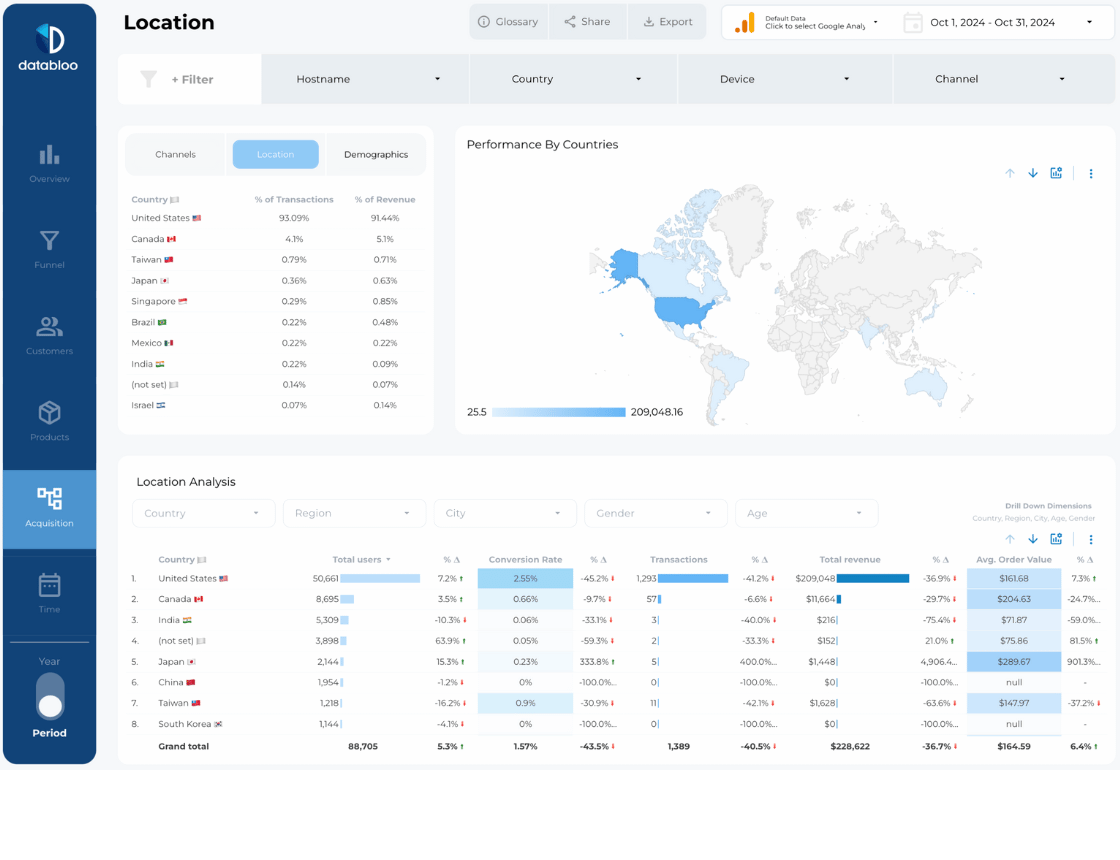
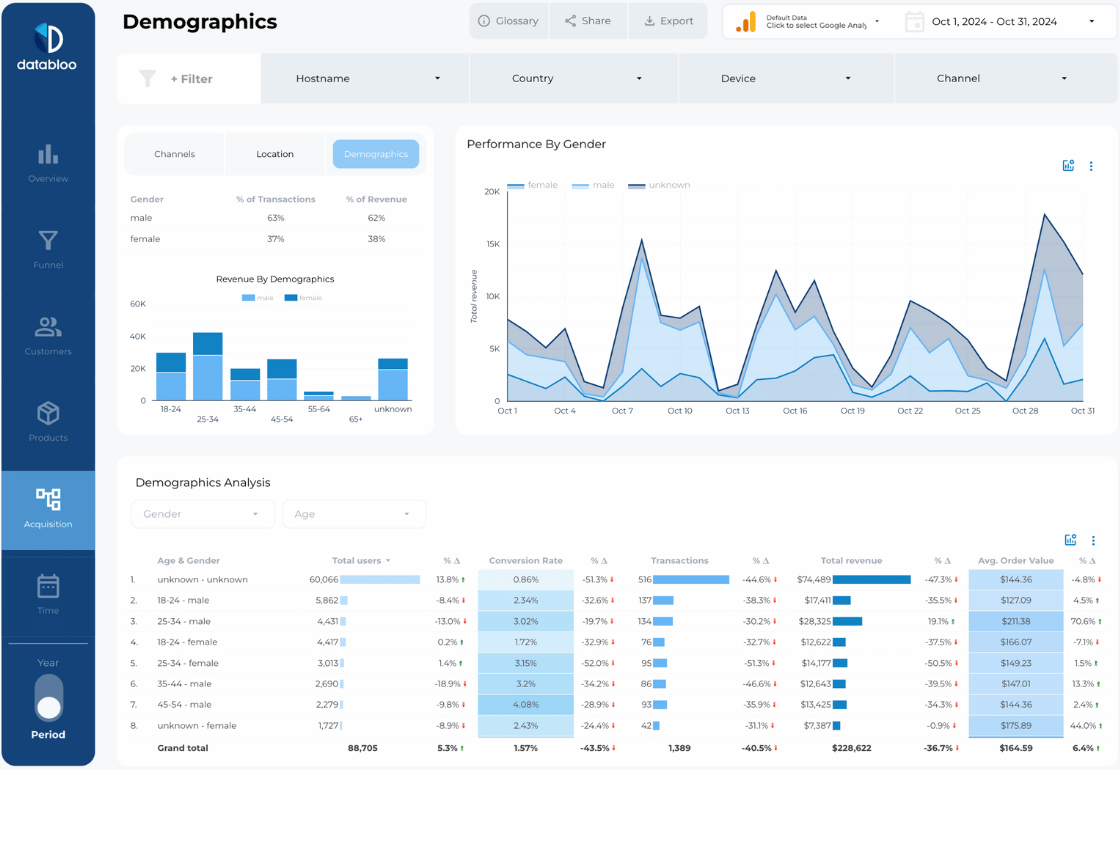
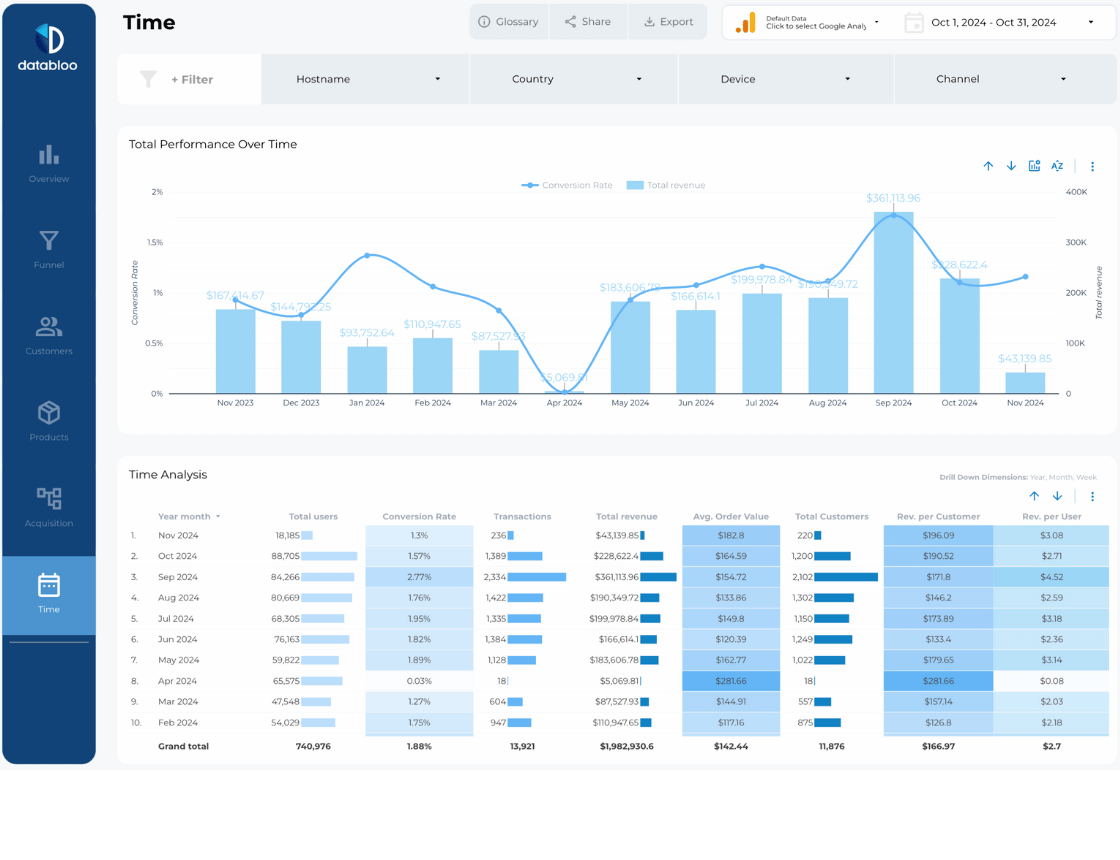
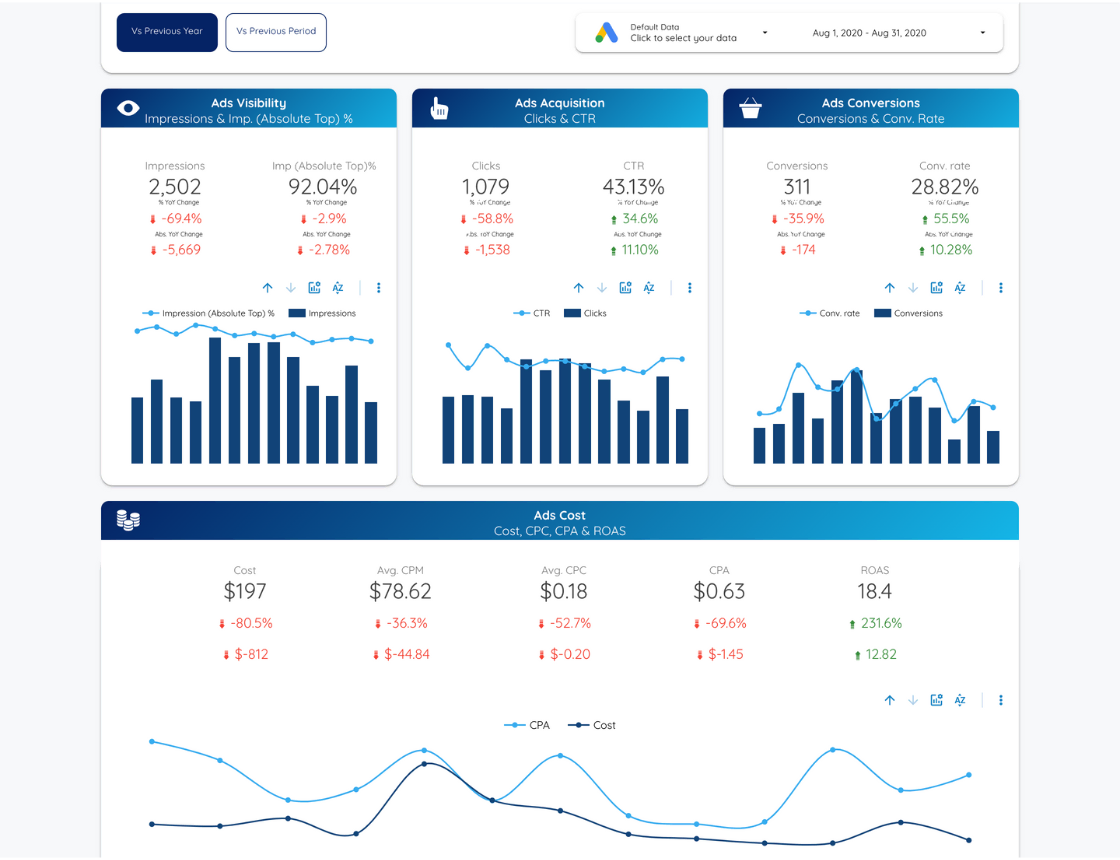
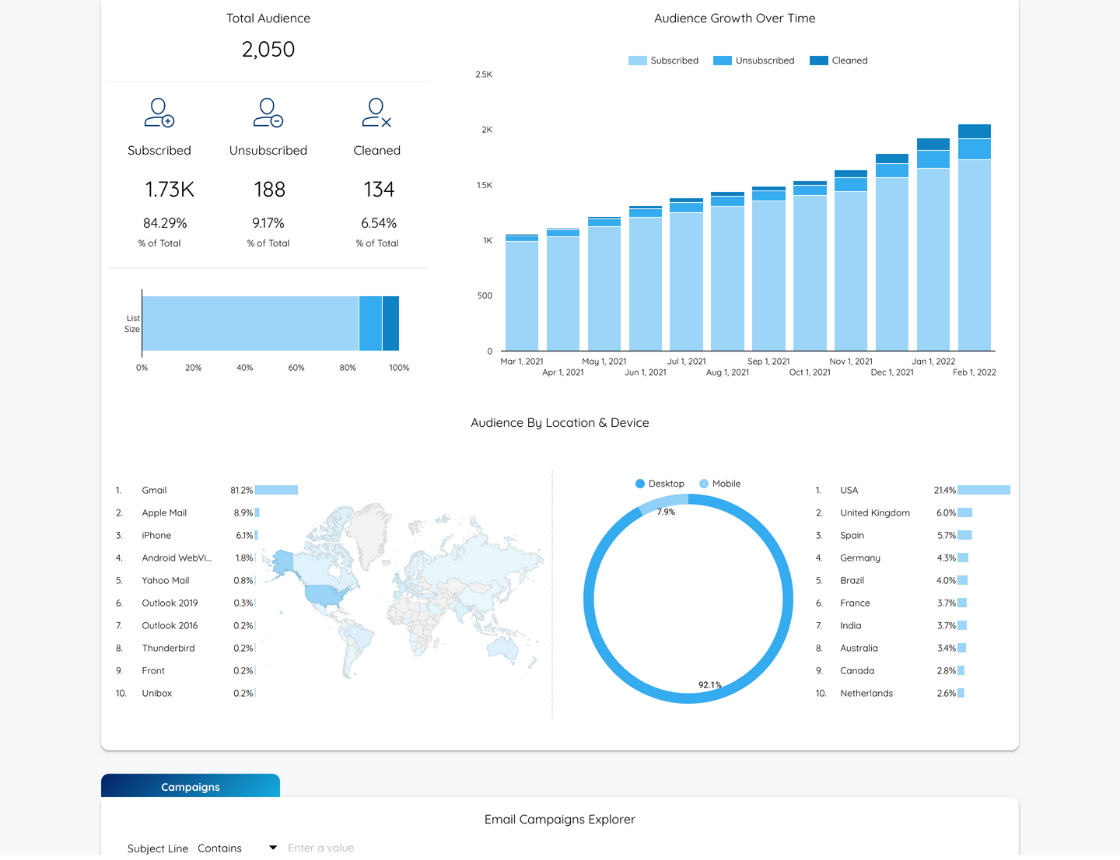
Drill down into key elements of our GA4 Ecommerce Looker Studio Template to answer pertinent business questions such as:
Your GA4 analytics ecommerce data answers all these questions and more through a fully customizable and intuitive template.
Focused Insights Across All Tabs
Enjoy effortless switching on this Looker Studio Ecommerce dashboard from one tab to another through the tab indicators on the left-hand margin. These tabs or pages drill down into GA4 data to reveal insights into each contributor of your ecommerce store. These tabs include:
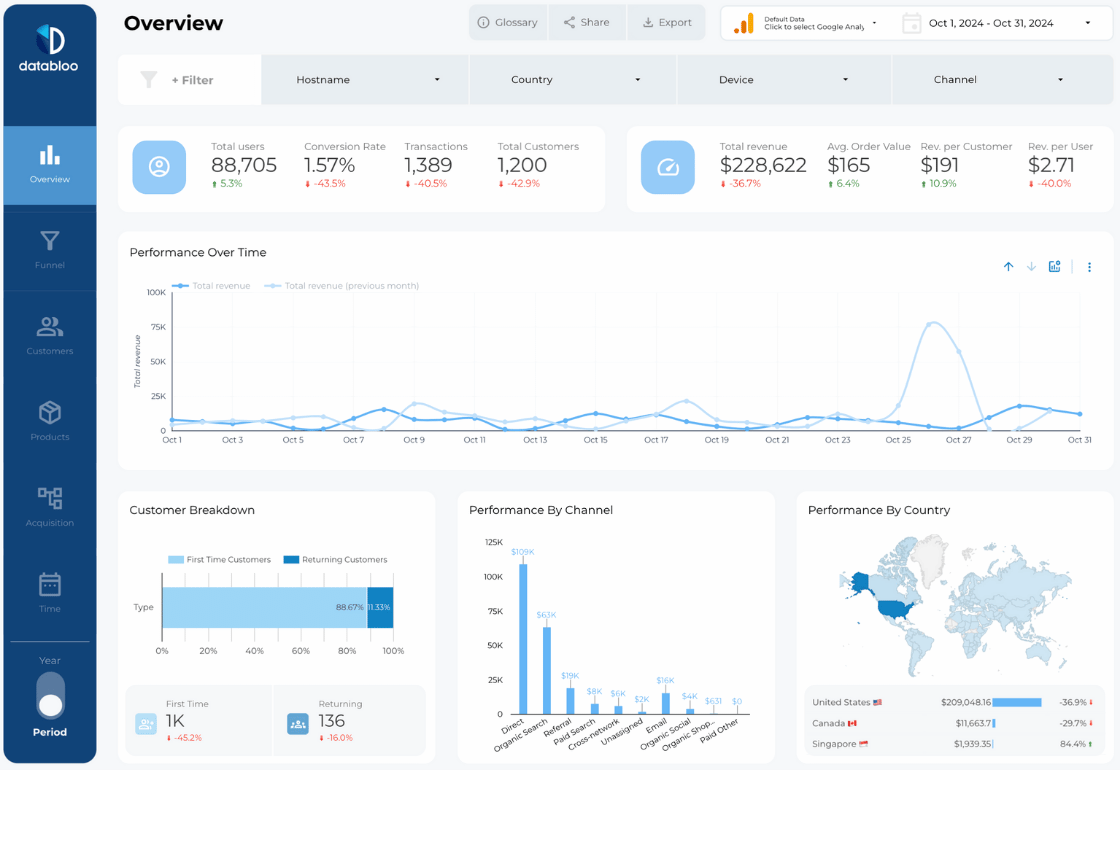
- Overview: View a highlight reel of your revenue performance over a period of time, such as daily, weekly, 30 days, or longer. It gives you the condensed version of your sales KPIs with highlights such as the total purchasers, first-time purchasers, overall purchases, quantity, revenue, and average price. Also, it splits your revenue by channel, country, and device.
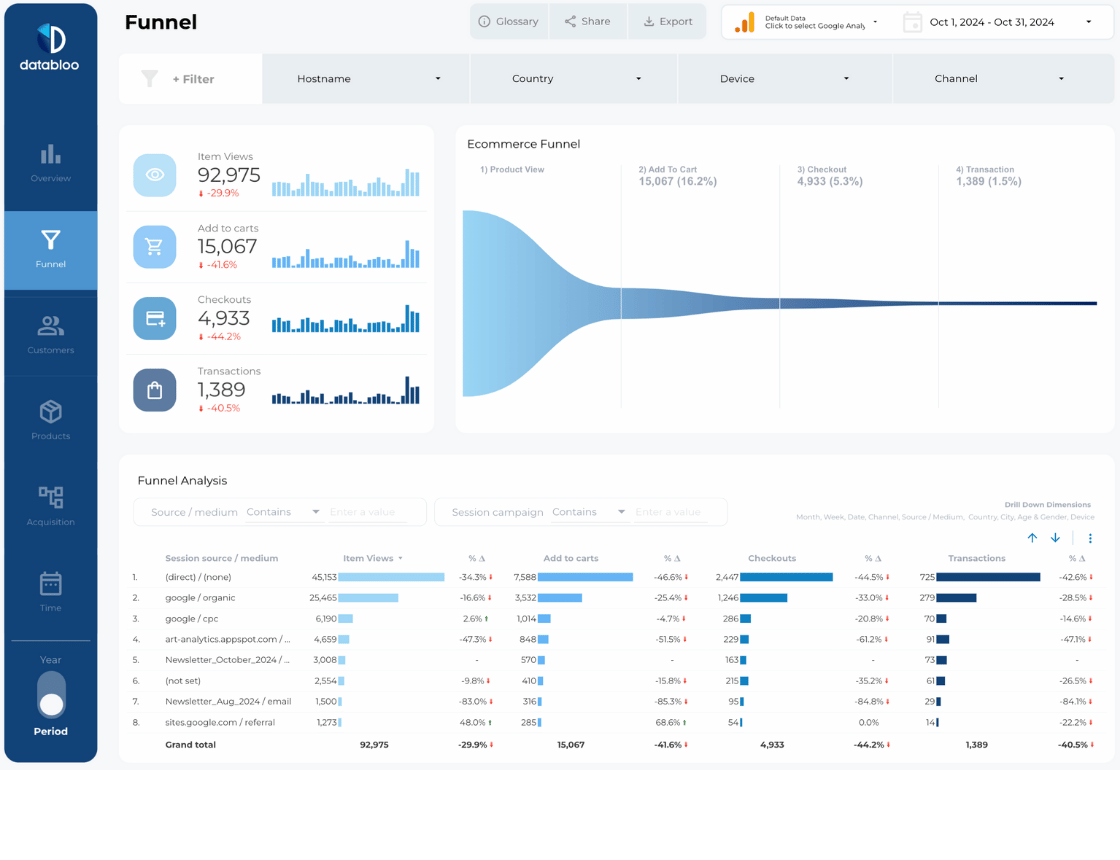
- Funnel: Tap into your sales funnel movement and view data such as your conversion process from product views and add-to-carts to checkouts and transactions. View these ecommerce events as a percentage as it transitions from views to transactions. You can also view your events over time with a monthly, weekly, and daily breakdown.
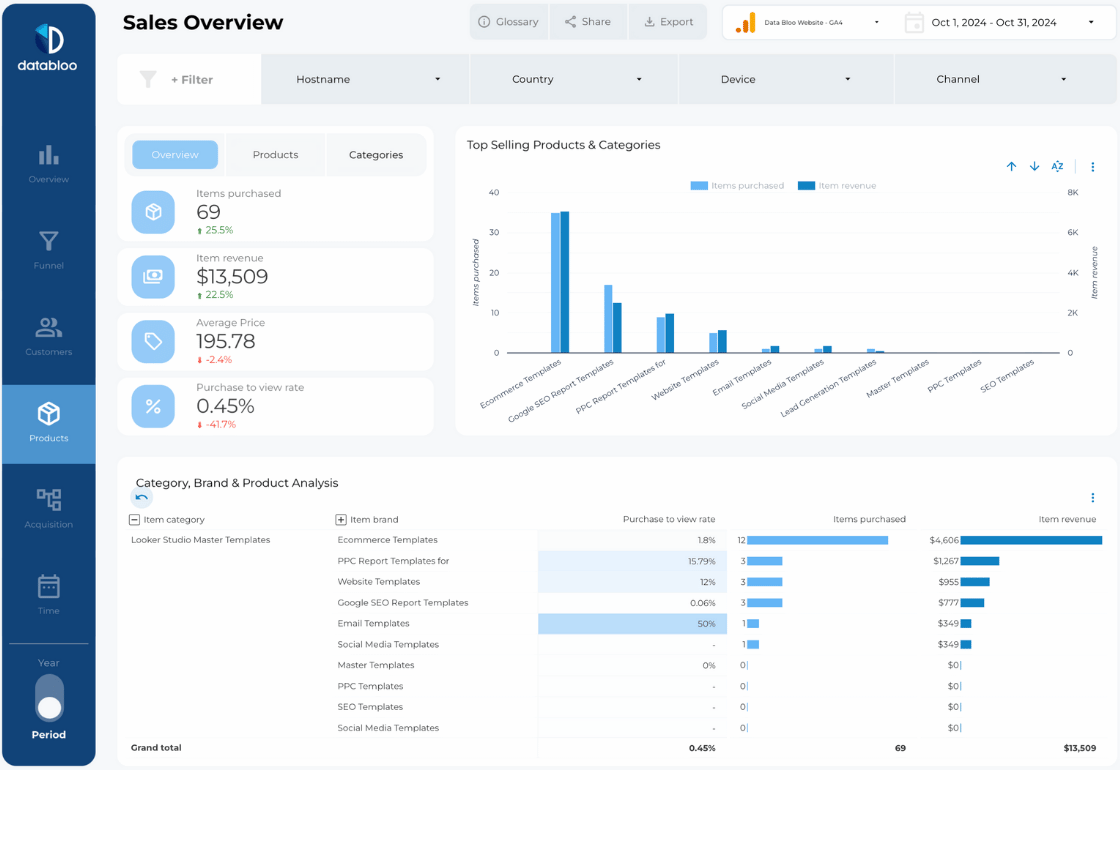
- Products: Find out which of your products contributed most to your ecommerce success with a full breakdown of the products sold, product revenue, and the average price of the products. The page provides insights into your top-selling brands & products and reveals the quantity and item revenue for a chosen time period. The detailed table at the bottom shows the breakdown of your top products/brands by quantity, revenue, and average price.
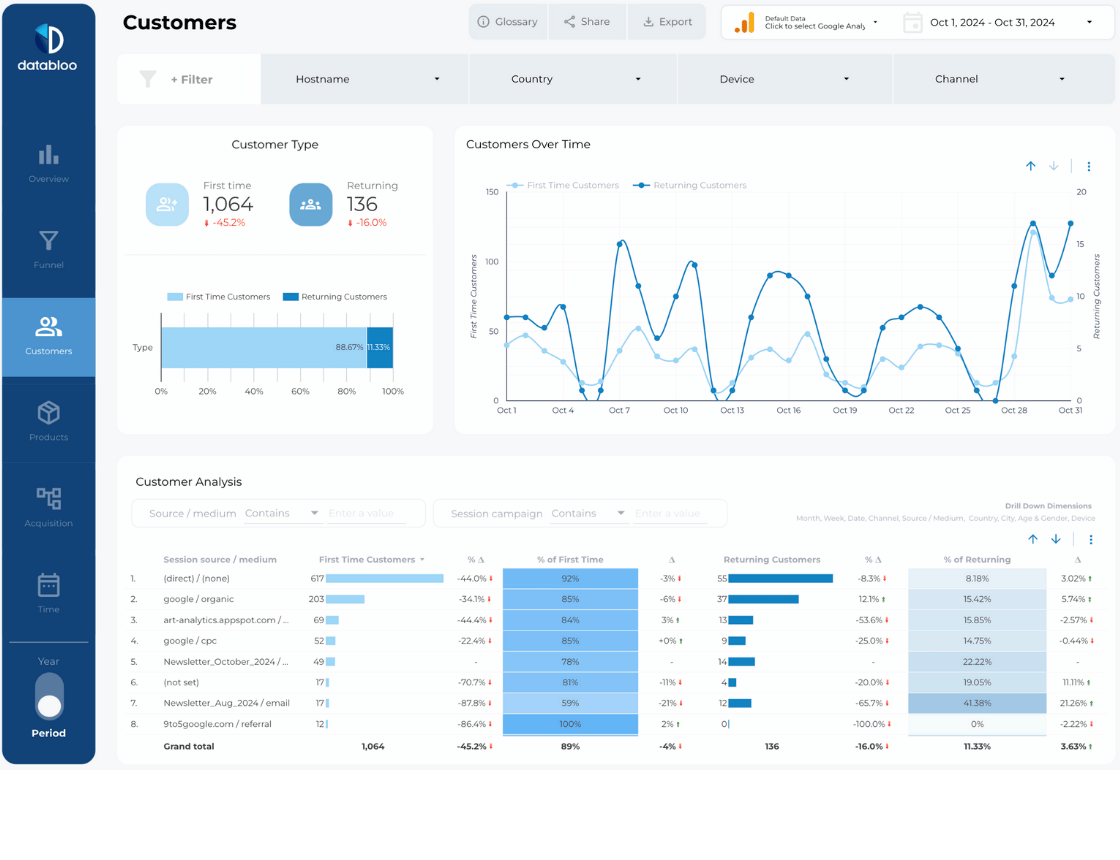
- Analysis: Discover which of your marketing channels resulted in the highest conversions by drilling into the channels such as direct, organic search, email, organic social, referral, and more. You’ll have insights into the revenue by country and which device accounted for the most sales.
Improve Your Conversion Rate
Track the data that drives your conversion rate such as your sales funnel process and how many views lead to transactions. These insights help to:
- Target your marketing to drive sales across devices and regions
- Gain a better understanding of your top sellers and highest-earning products
- Discover insights that help you refine your content to drive organic traffic
- Harness your existing client base and improve your cross-sell rate
- Turn new customers into repeat customers
Quick Set-Up and Data Source Versions
You can set up your GA4 Ecommerce Revenue Template following our detailed instructions that make it simple for anyone to get started, even if you’re a beginner in Looker Studio.
This Ecommerce Looker Studio report uses GA4 native connector of Google. Once you get edit access to these versions, you will have the flexibility to customize the reports to meet your own needs.


