What Ecommerce Metrics Are Most Important To Track?
There’s so many ecommerce KPI to track that it’s easy to get overwhelmed and miss valuable information.
For that reason, let’s group ecommerce metrics and offer suggestions on what ecommerce ecommerce looker templates best use in your scenario.
You can read a detailed breakdown of the most important ecommerce KPIs in this article.
Funnel Efficiency
This group of metrics lets you quickly understand how efficient you are in converting your visitors into customers. Most common metrics are below:
- Conversion rate. How many visitors you convert into customers, in %.
- Checkout drop. How many people start the checkout process, but never finish it.
- Cart abandonment. How many people add products to the cart, but don’t proceed to checkout.
- Traffic source efficiency. Conversion rate for each individual type of traffic (mobile, paid, video, etc.)
Revenue
Revenue metrics either indicate ecommerce revenue directly, break revenue into several streams, or correlate with revenue more directly than other metrics.
- Total Sales. Sum of all product and services sales in a given period.
- Gross Margin. Percentage of revenue after expenses.
- Average purchase value. Total revenue divided by number of orders.
- Revenue by country. Either total sum or % share.
- Revenue by device. Typically in %.
- Customer lifetime value. Projection of how much, on average, a customer will spend on your products in their lifetime.
Costs
Any metrics related to costs and expenses, such as cost of acquisition, cost per click, cost per impression, cost per leads, and so on.
What Ecommerce Template Should You Choose?
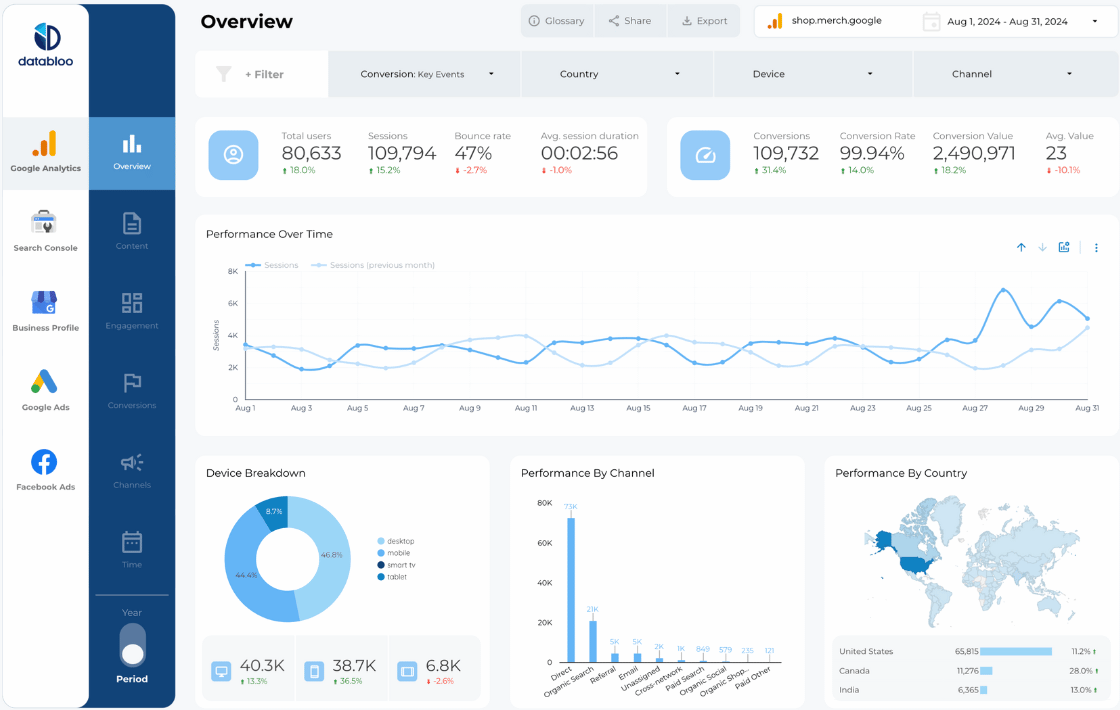
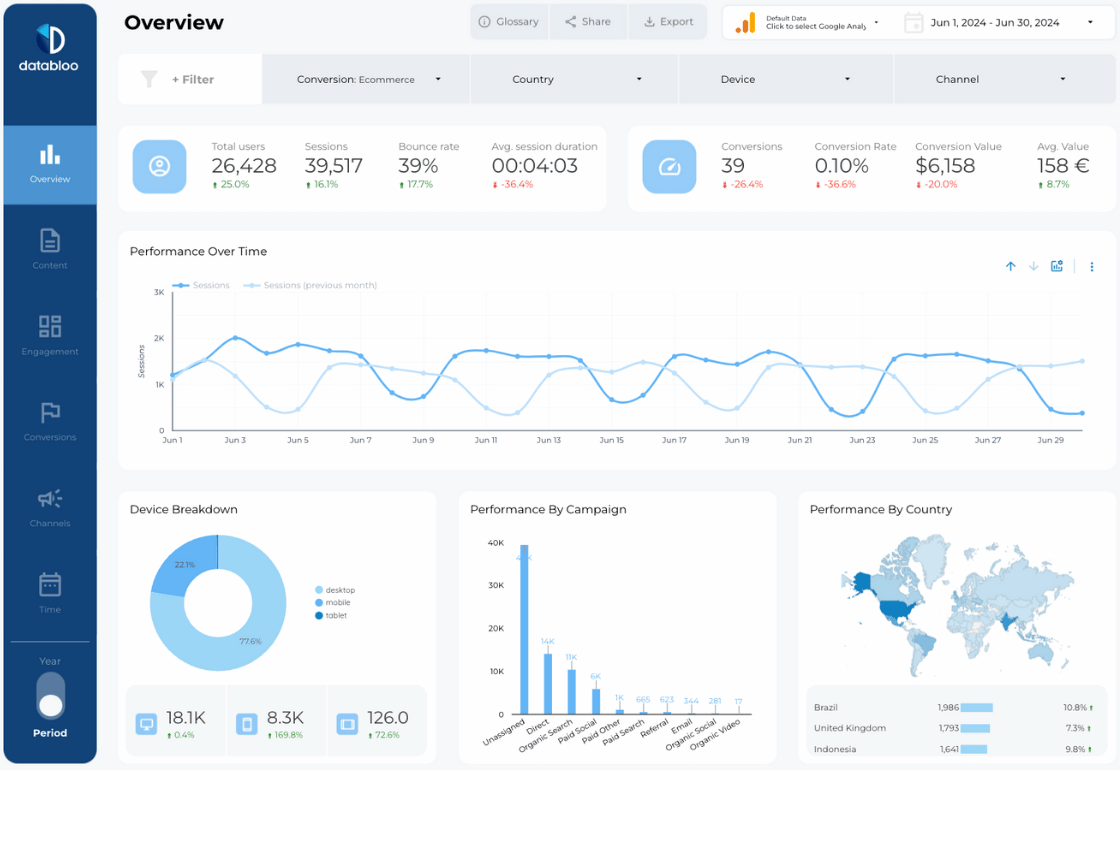
Template #1. Ecommerce Conversion Funnel Template
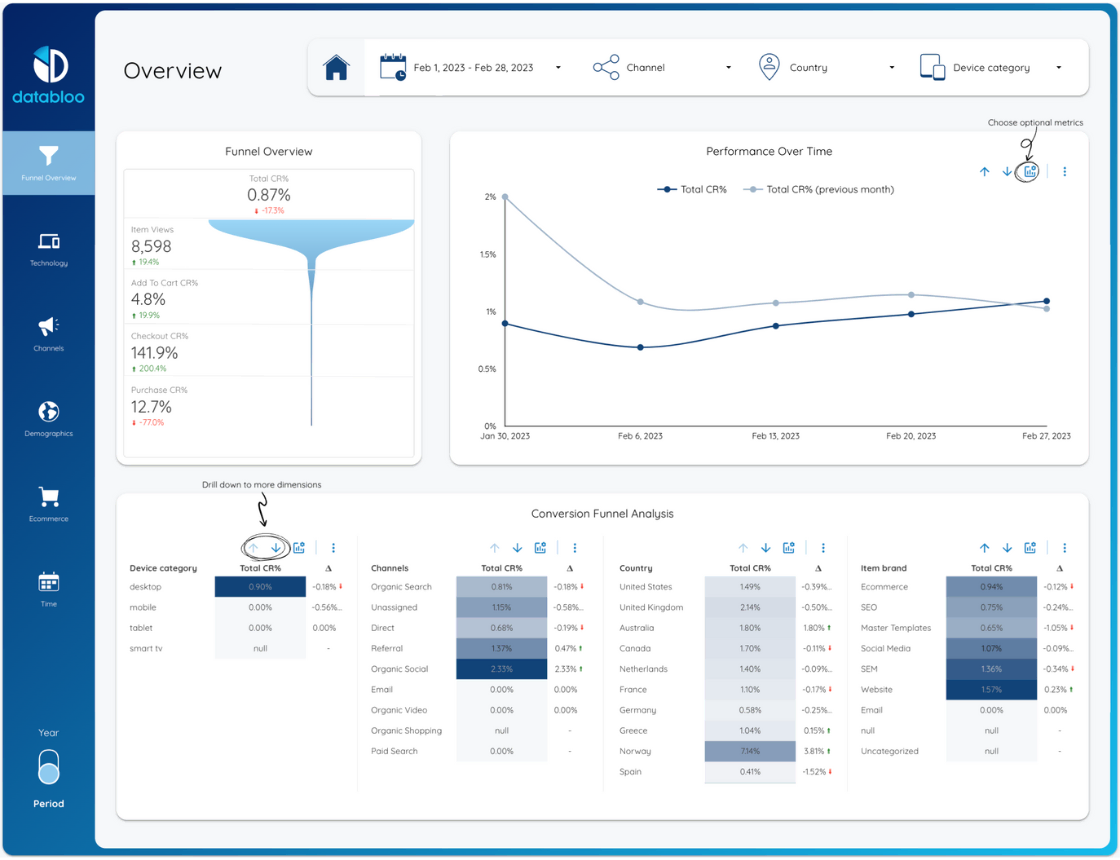
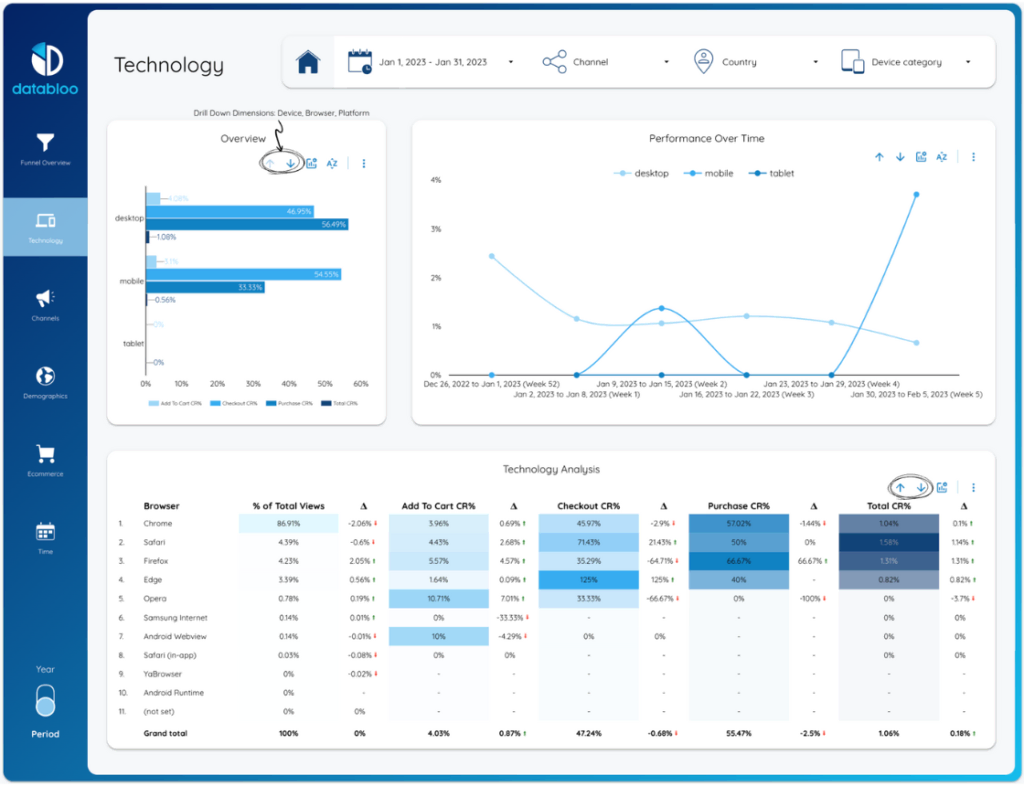
Ecommerce conversion funnel template for Looker Studio is designed for comprehensive tracking and analysis of the customer journey through the ecommerce conversion funnel.
Choose this template to:
- Visualize the progression from item views to purchases with clear conversion rate (CR%) indicators for each funnel stage.
- Identify trends in performance over time to adjust marketing and sales strategies effectively.
- Drill down into dimensions such as device category, channels, and geographic performance to optimize targeting and resource allocation.
This reporting template will help you answer the following questions:
- How do conversion rates differ across various stages of the customer journey?
- What trends in conversion rates are emerging over time, and how do they compare to previous periods?
- Which channels, devices, and countries are performing best in terms of conversion rates?
Template #2: GA4 Ecommerce Revenue Template
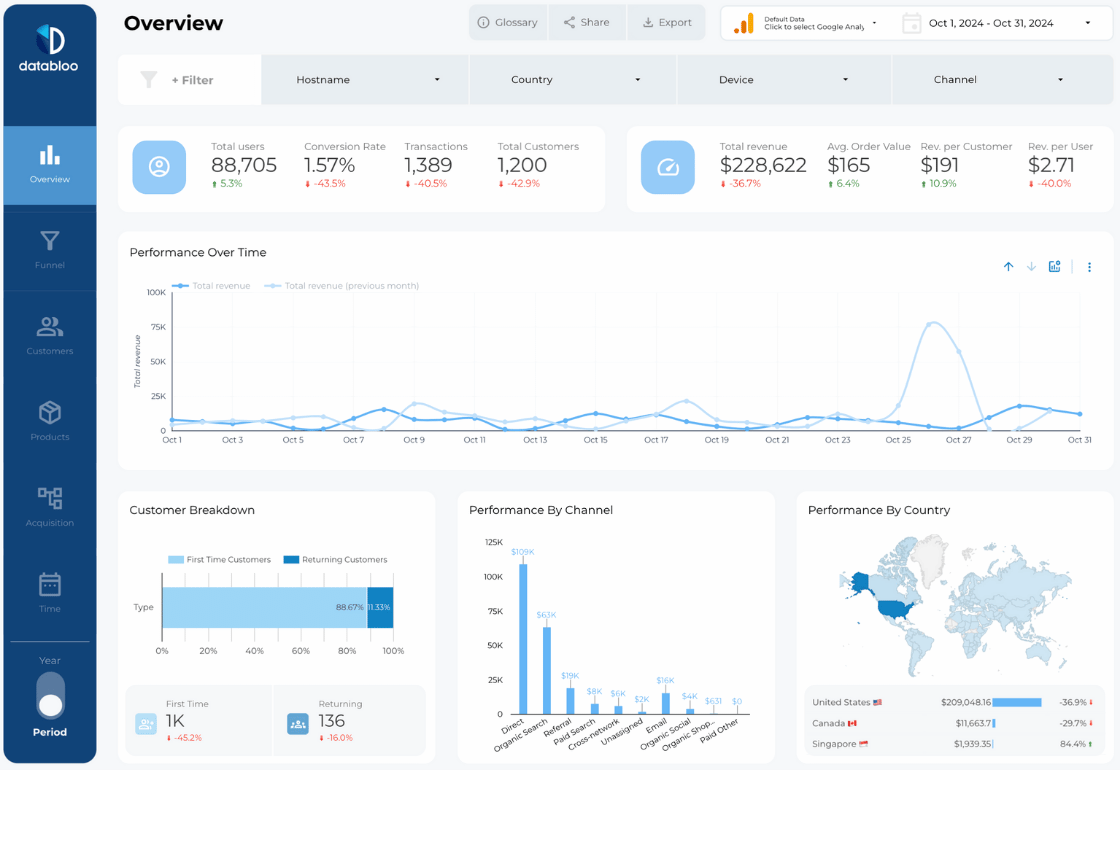
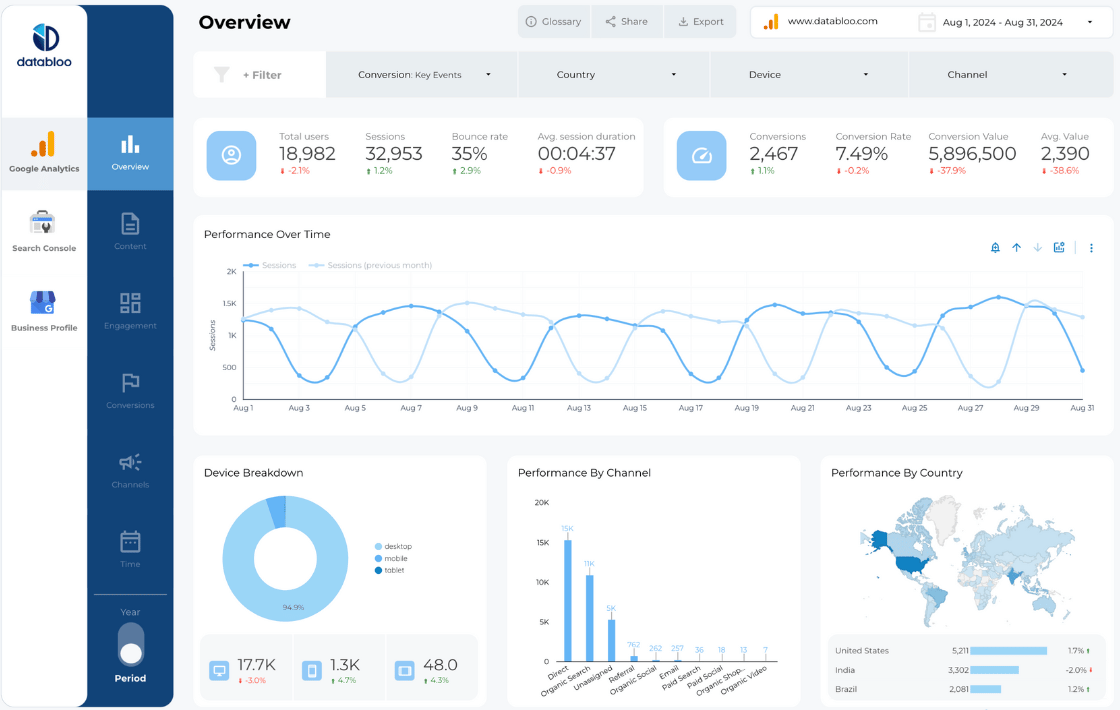
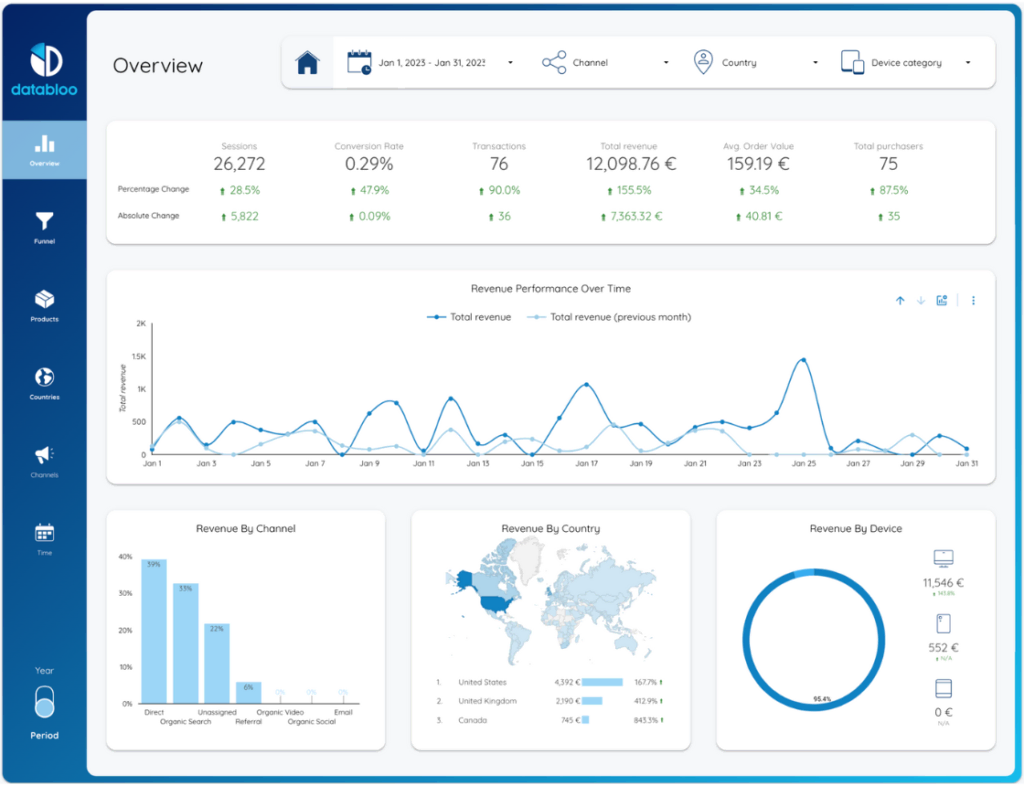
GA4 e commerce revenue reporting template offers a detailed view of revenue metrics and their performance over time in an ecommerce setting.
Choose this template to:
- Track revenue trends with the ability to compare current performance against previous periods.
- Analyze revenue distribution across different channels, countries, and devices to identify where sales are strongest.
- Gain insights into average order value and conversion rates to fine-tune pricing and marketing strategies.
What questions GA4 ecommerce revenue template answers:
- What is the trend in total revenue over a specific period, and how does it compare to the previous month?
- How does revenue contribution vary across different marketing channels and what is their performance impact?
- Which countries and devices contribute most to the revenue, and how have these trends changed over time?
Template #3: GA4 Periodic Revenue Template
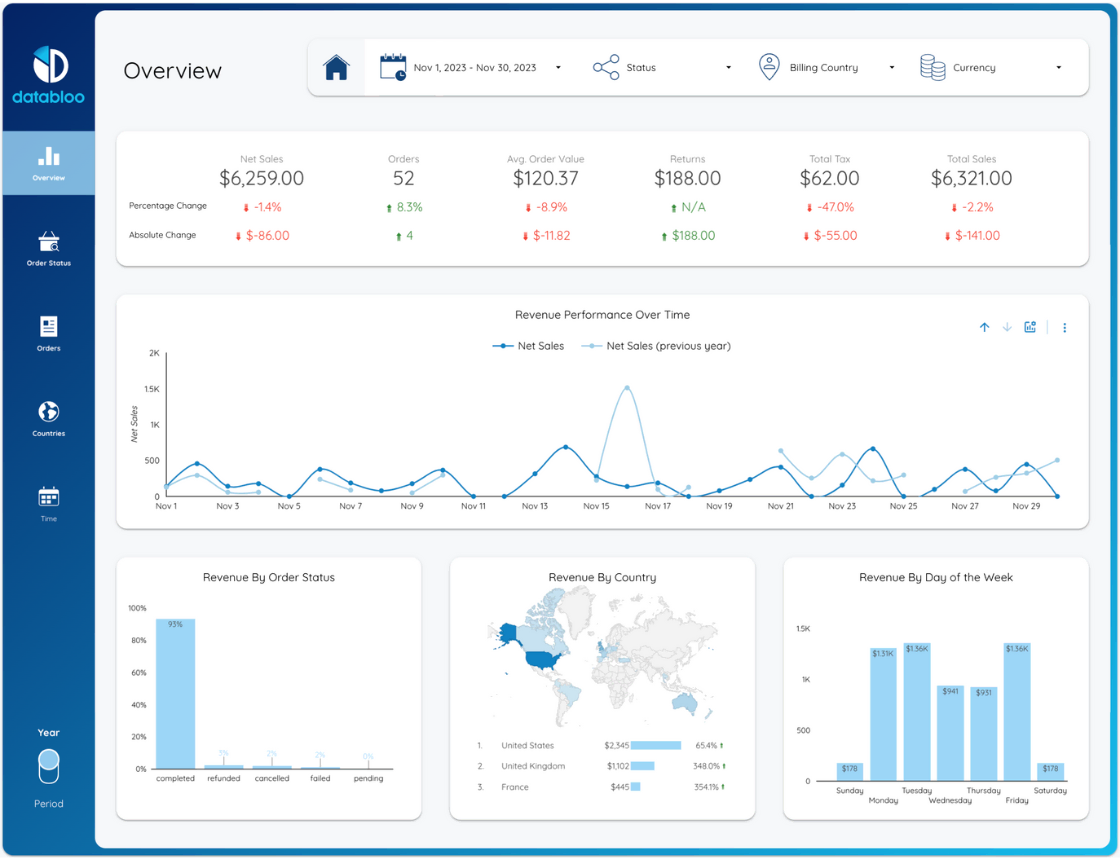
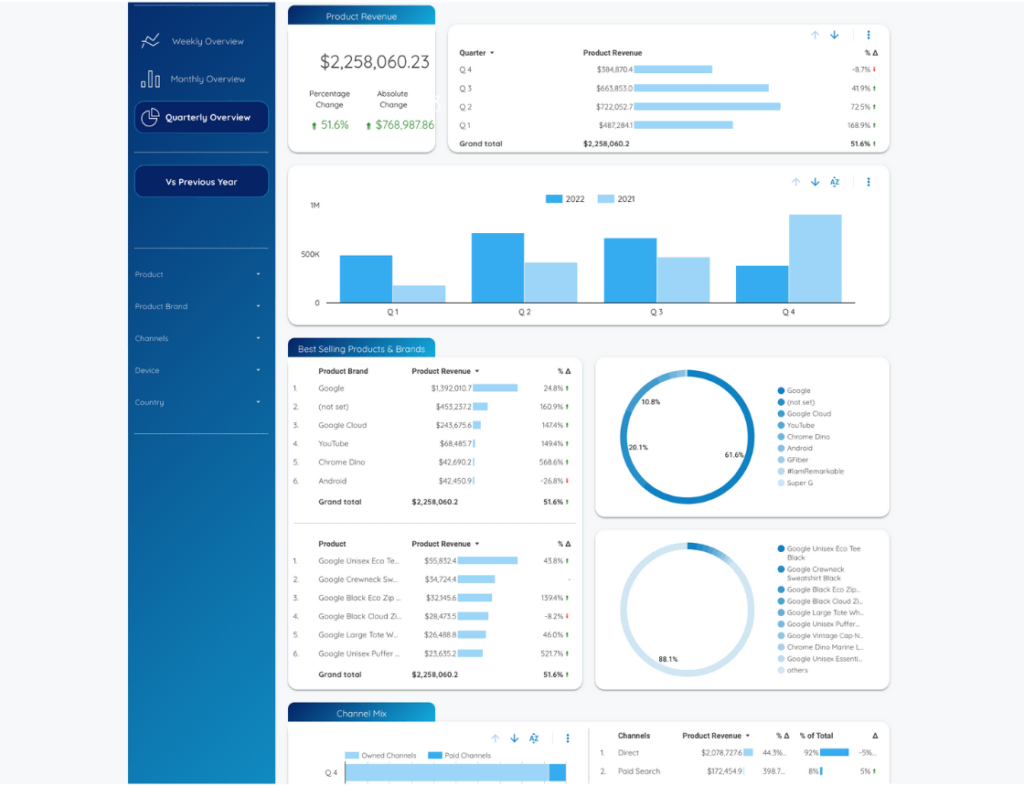
Periodic revenue template provides an in-depth analysis of revenue streams over set periods, offering tactical insights into sales performance and product popularity.
Choose this template to:
- Assess weekly, monthly, or quarterly revenue fluctuations to inform business and marketing decisions.
- Understand which products and brands are performing best, informing inventory and promotional strategies.
- Evaluate channel effectiveness to optimize marketing spend and focus on the most lucrative platforms.
What questions it answers:
- How does current product revenue compare to the same period in the previous year, and what is the rate of growth or decline?
- Which specific products or brands are leading in sales, and how has their revenue contribution changed over the period?
- What percentage of total revenue is attributed to different sales channels, and how does this inform channel performance?
How Do I Set Up Automated Ecommerce Reporting With Looker Studio?
When you start using any of our ecommerce looker templates, it will automatically connect to required data streams (such as GA4 or Google Search Console) and fill the report with your data.
Additionally, Looker Studio allows scheduling automated reporting in your email inbox.

