Table of Contents
Overview
- Data Source: Google Analytics 4 (GA4)
- Type: Percentage (%)
- Calculation: (Number of Times a Product is Added to Cart / Number of Times the Product is Viewed) * 100
Definition
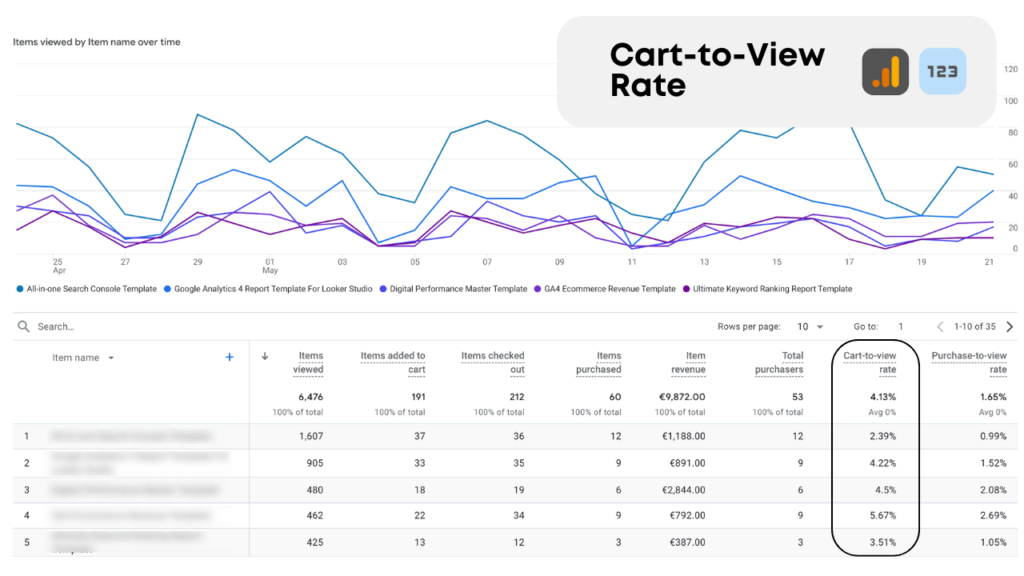
Cart-to-View Rate in Google Analytics 4 measures the efficiency with which product views translate into additions to the shopping cart. It is calculated by dividing the total number of times a product is added to a cart by the total number of times that product’s page has been viewed, then multiplying by 100 to express the result as a percentage.

Description
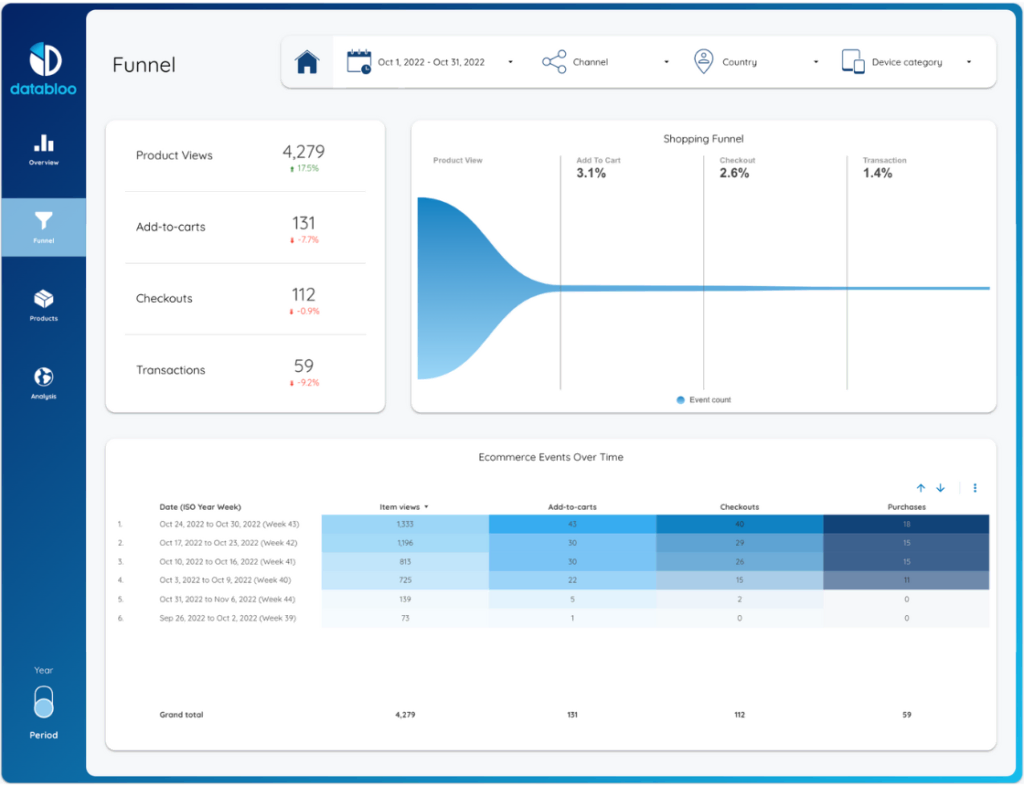
The Cart-to-View Rate is a critical eCommerce metric that provides insights into the initial phase of the conversion funnel, indicating how effectively product page views lead to purchase intent. A higher rate suggests that the product pages are compelling and persuasive, encouraging users to consider a purchase by adding items to their cart.
Use Cases
- Product Page Optimization: Analyze Cart-to-View Rates to identify product pages that effectively encourage cart additions, and use these insights to optimize other product pages for higher conversion potential.
- Content and Offer Tuning: Adjust product descriptions, images, pricing, and offers based on Cart-to-View Rate insights to enhance the appeal of product pages and increase the likelihood of cart additions.
- A/B Testing: Conduct A/B testing on various elements of the product page, such as calls-to-action, layout, and promotional messages, to identify changes that positively impact the Cart-to-View Rate.
- User Engagement Strategies: Develop strategies to increase user engagement on product pages with lower Cart-to-View Rates, such as enhanced product recommendations, customer reviews, or interactive elements.
- Marketing and Promotion Effectiveness: Evaluate the impact of targeted marketing campaigns and promotions on increasing Cart-to-View Rates for specific products or categories, guiding future marketing efforts.

Indicators
- Positive Indicator: A high Cart-to-View Rate indicates that product pages are effectively converting views into potential purchases, reflecting well on product presentation and page design.
- Negative Indicator: A low Cart-to-View Rate may highlight issues with product page content, user experience, product appeal, or pricing, suggesting areas for optimization to improve conversion potential.

