Table of Contents
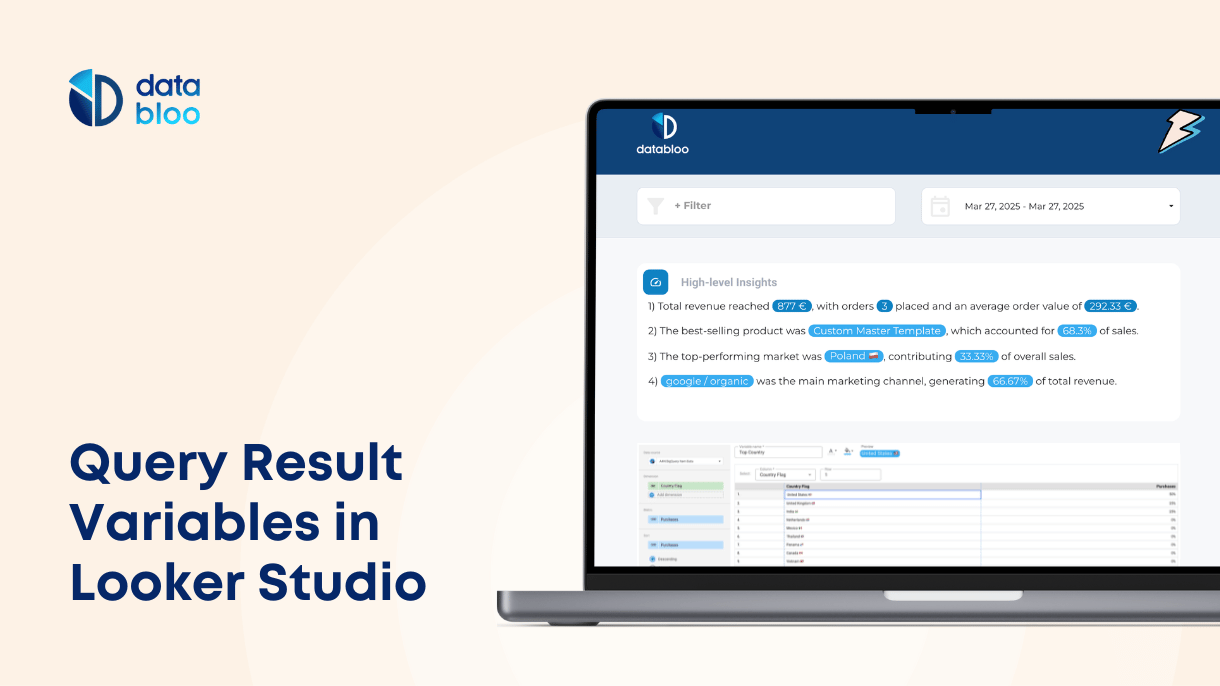
In April 2025, Google introduced another exciting upgrade to Looker Studio: Query Result Variables, also known as “Chips.” This new feature allows you to insert live data directly into your text elements—opening up a new way to describe, summarize, and highlight insights beyond charts and tables.
Instead of simply showing numbers in a scorecard, you can now create sentences like:
“Last month, revenue from Germany was $12,300—accounting for 26% of total sales.” That number isn’t static. It updates every time the report refreshes.
In this guide, we’ll show you how Query Result Variables or Chips in Looker Studio work, where to use them, and examples to inspire your next report.

What Are Query Result Variables (Chips)?
Query Result Variables let you insert dynamic data values inside text boxes in your Looker Studio reports. You can pull metrics or dimensions from your data source, format them, and then display them as “chips” that automatically update when the data changes.
These chips act as mini data queries that live inside your text. You set the dimension, metric, and optional filters, and Looker Studio inserts the result in-line—making your reports easier to read and more engaging.
You can add chips from the text editor by typing @ and either selecting an existing chip or creating a new one.

How to Create a Query Result Variable
Creating a chip is simple. Here’s how:

- Open your report and select a text element (or add a new one).
- Type @ inside the text box. A menu will appear.
- Click Add a variable, give it a name, and set up the query:
- Choose the data source.
- Pick one metric (like Revenue).
- (Optional) Add dimensions or filters (like Country = France).
- Choose a row and column value from the preview table.
- Customize its appearance (text color or background).
- Click Save, and your chip will appear inside the text.
Each time the report refreshes, the chip’s value updates automatically. You can manage all your chips later under Resources > Manage variables (parameters).

Where to Use Chips in Looker Studio
Chips make your reports more descriptive and interactive, especially in use cases where written context improves understanding. Here are a few practical ways to use them:
Report Summaries
At the top of your report, use chips to highlight the most important numbers—such as monthly revenue, top-performing countries, or conversion rates. Instead of separate scorecards, you can turn these into a written summary for execs or clients.
Scheduled Reports & Email Digests
If you send out weekly or monthly reports, chips are perfect for automated summaries. Use them to describe key changes in performance with real-time values
You can now send digest-style reports with data that reads like a narrative.

Single-Page Insights Dashboards
If you have a single-page dashboard designed to answer a specific business question—like “How did our sales team perform this week?”—you can insert chips to summarize those results in one glance.
This is a great way to pair metrics with context for business users who may not want to read through detailed tables.
4 Example Use Cases
Here are some creative ideas for using chips across different types of reports:
Weekly Ecommerce Performance Summary
Over the past 7 days, total sales amounted to [@Revenue], coming from [@Orders] orders, with an average order value of [@AvgOrderValue].
The country generating the most revenue was [@TopCountry], making up [@CountryRevenueShare]% of weekly sales.
[@TopChannel] was the leading traffic source, contributing [@ChannelRevenueShare]% of total revenue.
The top-selling product this week was [@TopProduct], which brought in [@ProductShare]% of all sales.
Monthly SEO Performance Summary
In the last 30 days, your site received [@Clicks] organic clicks and [@Impressions] impressions from Google Search.
The average click-through rate was [@CTR]%, and the average ranking position was [@AvgPosition].
Your most searched keyword was [@TopKeyword], while [@TopLandingPage] attracted the highest search traffic.
The country bringing the most SEO traffic was [@TopCountry], contributing [@CountryShare]% of clicks.
Website Engagement Snapshot
Yesterday, the website had [@Sessions] sessions from [@Users] users, with an average engagement time of [@AvgEngagementTime].
The most viewed page was [@TopPage], with [@PageViews] views. [@ReturningUsers]% of users were returning visitors, indicating strong loyalty.
The highest traffic came from [@TopChannel], and [@TopDevice] was the most used device.
Bounce rate was [@BounceRate]%, signaling [@BounceTrend] in user interaction.
Google Ads Performance Summary
In the past 7 days, your Google Ads campaigns generated [@Conversions] conversions from [@Clicks] clicks and [@Impressions] impressions.
The overall click-through rate (CTR) was [@CTR]%, with a cost per click (CPC) of [@CPC] and cost per conversion of [@CPA].
You spent a total of [@AdSpend], resulting in a return on ad spend (ROAS) of [@ROAS].
The best-performing campaign was [@TopCampaign], driving [@TopCampaignConversions] conversions at a [@TopCampaignCPA] CPA.
The top keyword was [@TopKeyword], and [@TopDevice] was the most used device among converters.
What You Should Know (Limitations)
Chips are powerful, but they come with a few things to keep in mind:
- Chips only work inside text boxes—you can’t use them inside charts or tables.
- Each chip is based on one data source. You can’t pull blended data into a chip (yet).
- If your query returns multiple values, you must select a single cell to insert—chips only show one number or value.
- In some cases, you may need to adjust line height in the text box so the chip displays correctly.
That said, this feature is still evolving. It’s likely Google will add new capabilities over time—such as support for images, blended data, and conditional formatting.
A Smart Way to Make Reports More Conversational
Query Result Variables (chips) open up a new way to build data narratives inside your reports. Whether you’re summarizing key performance metrics, sending weekly reports to stakeholders, or guiding users through a page of insights, chips help you combine text and data into one cohesive experience.
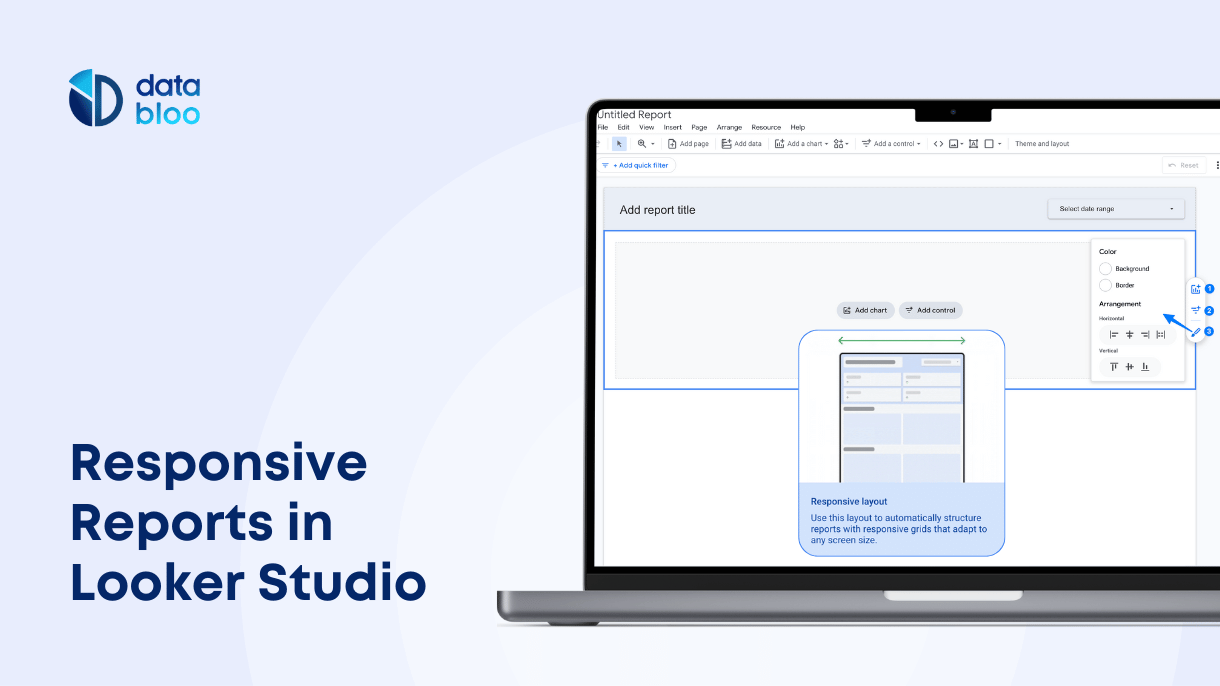
And when used with responsive reports, they become even more powerful—giving users a mobile-friendly dashboard with human-readable summaries at the top.
At Data Bloo, we’re already testing this feature across our latest Looker Studio templates. Try it out and see how easy it is to turn charts into stories.


