Table of Contents
Building marketing funnels in Google Looker Studio simplify the process of tracking leads and customer behavior. They offer critical insights into how buyers respond, helping businesses monitor their investments, understand consumer behavior, and identify which channels perform best.
A marketing funnel in Looker Studio helps you continuously behavior trends, allowing you to stay on top of shifts in customer engagement. In this guide, we’ll walk you through the steps of building a marketing funnel using Looker Studio to better visualize and track your data.
What is a Marketing Funnel on Looker Studio?
A marketing funnel is a visual representation of the steps a potential customer takes from becoming aware of a product or service to making a purchasing or completing a specific goal (any desired action or key event in GA4 for your online business). Typically, the funnel starts wide, representing a large pool of potential customers, and narrows as prospects advance through each stage. This chart provides key insight into customer behavior and shows where users may drop off.
Creating a marketing funnel in Google Looker Studio enables you to combine data from different sources into one platform. For instance, you can blend data from your ads to website visits and back-end purchases in just one funnel. Then you can design an interactive and comprehensive data visualization that shows the entire journey from ad to purchase and can be easily shared with all the stakeholders involved. A nice marketing funnel would not only be attractive, but it should also reflect your marketing effectiveness through data.
3 Types of Marketing Funnels on Looker Studio
Marketing funnels can vary depending on the objective of your analysis. Let’s take a look at three common types of funnels you can create on Looker Studio:
- Website Funnel:
A website funnel is used to represent the progress through various stages on your website, such as from landing page views to conversions. Ideal for e-commerce and other online retail businesses, it tracks the entire journey from the number of people visiting the site, to the number of visitors who actually buy the product or service from this website.
- Marketing Funnel:
This type focuses on the steps between the clicks of a specific marketing paid or owned channel (i.e. ad clicks from Facebook Ads, or clicks from organic search) and the completion of conversions. For example, it tracks users visited your website after clicking on a ad, and measures how many became customers or leads (depends on the business model).
- Sales Funnel:
This funnel is used to represent the journey of a customer from product or service awareness to purchase. It’s ideal for SaaS and other subscription models, allowing you to track key actions like free trial signups or purchases.
Difference between Marketing and Sales Funnels
There is a very slight difference between the three types of funnels we discussed above. The most commonly used funnels are the marketing funnel and sales funnel. Both tell a similar story – the steps a customer goes through from the perspective of a buyer.
It can be hard to differentiate between the two funnels as both are used in marketing and analysis of customer behavior.
Marketing is used to generate awareness about the product and create its demand among the customers. It helps marketers track how users move through stages like ad clicks and website visits before becoming potential leads.
On the other hand, a sales funnel narrows the focus to converting those leads into paying customers. It maps the journey from interest (generated by marketing efforts) to purchase, focusing on conversions as the primary goal.
How to Create A Funnel on Looker Studio Data Studio
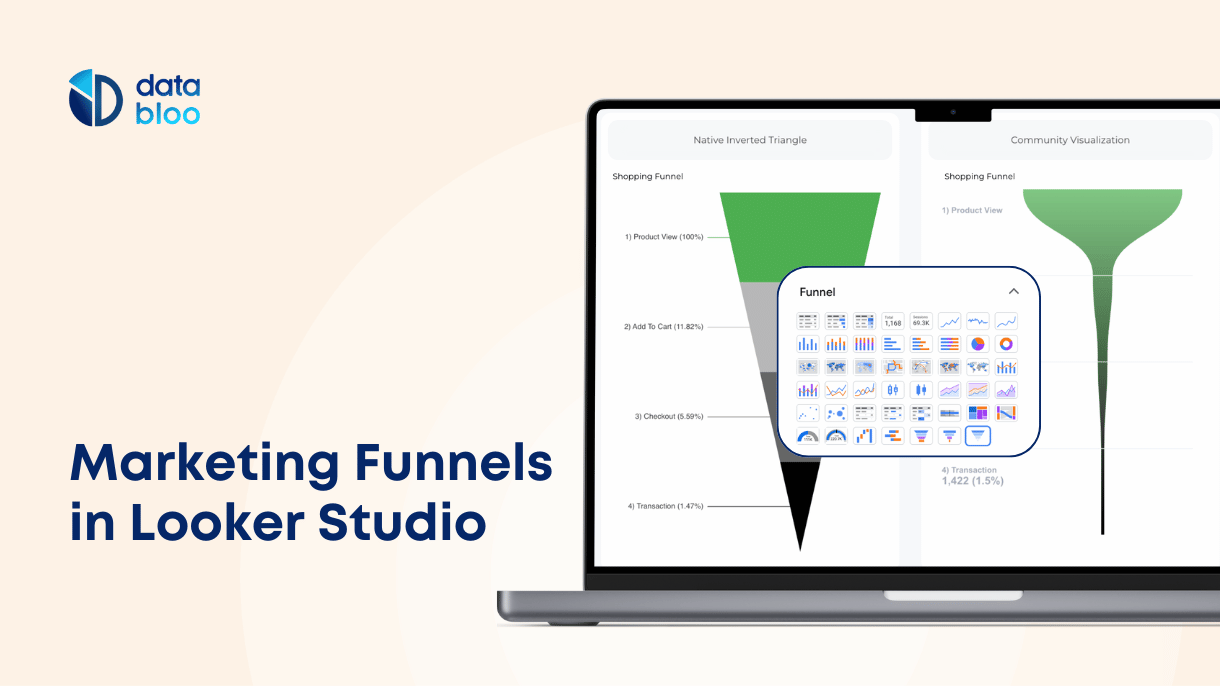
Now that you understand what a marketing funnel is, let us guide you through a step-by-step process on how to create a funnel in Google Looker Studio. There are two different ways to add a funnel chart to a report: using the native funnel chart by Google or by utilizing community visualizations.

1. Native Funnel Chart in Looker Studio
In September 2024, Google introduced the Funnel Chart to Looker Studio, making it easier to visualize conversion paths directly from the available chart types. You can choose from three types of funnel charts: smoothed bar, stepped bar, and inverted triangle, depending on how you want to display your data.
How to Add a Native Funnel Chart:
- Open your Looker Studio report and add your data source (such as GA4 or Google Ads).
- Select “Chart” from the toolbar and click “Funnel Chart.”
- Choose your dimensions (like different stages of user interaction) and metrics (such as conversions, clicks).
- Customize the chart by selecting the type (smoothed, stepped, or inverted triangle) to represent the data in a way that best fits your marketing funnel.
The native funnel chart provides a simple way to visualize customer journey stages and conversions, helping you identify where users drop off or convert.
When to Use Each Funnel Type?
- Smoothed Bar: This type is useful for visualizing gradual transitions between stages. It offers a continuous flow between steps, making it easier to see the overall trend of user progression. Use it when you want a softer visual representation of conversion stages, such as in a content marketing funnel.
- Stepped Bar: Stepped bars display a more distinct separation between stages, highlighting specific drop-offs at each step. This is ideal for tracking precise stages where customers might abandon the process, such as in an e-commerce checkout funnel where you need to measure steps like cart abandonment or purchase completions.
- Inverted Triangle: The inverted triangle visually represents the funnel in its most literal sense, showing the largest volume at the top and tapering to a point at the bottom. This is perfect for broad overviews, such as a lead generation funnel, where you want to see how traffic narrows through various interactions.
2. Community Visualizations: FunnelGraph
Before the introduction of the native funnel chart, users often used community visualizations such as Ayima Funnel Chart or FunnelGraph by TrueMetrics. These options offer more customization and control for users who need detailed funnel tracking.
How to Add a Community Visualization Funnel Chart:
- Open your Looker Studio report and click “Community Visualizations.”
- Click “Explore More” and “Build your visualization” .
- Add the manifest URL for FunnelGraph by TrueMetrics.
- Configure your funnel by adding dimensions (e.g., event names) and metrics (e.g., conversions, drop-offs) in a high-to-low order to reflect the steps of your funnel accurately.
- Customize the chart further by adjusting styles such as showing conversion rates or drop-off percentages.
FunnelGraph is particularly useful for advanced funnel visualization needs, allowing you to add different colors and present the actual numbers or the conversion rates for each step.
In summary, both the native funnel chart and community visualizations like FunnelGraph offer great solutions for visualizing marketing funnels in Looker Studio, with each method catering to different levels of complexity and customization needs.
What Dimensions and Metrics to use in Funnel Charts
Here are some indicative metrics for different funnel types:
- Website Funnel for Lead Generation: Sessions, Product / Service Page Views, Form Submissions
- Marketing Funnel: Organic Search or Ads Impressions, Organic Search or Ads Clicks , Landing Page Views, Free Trials
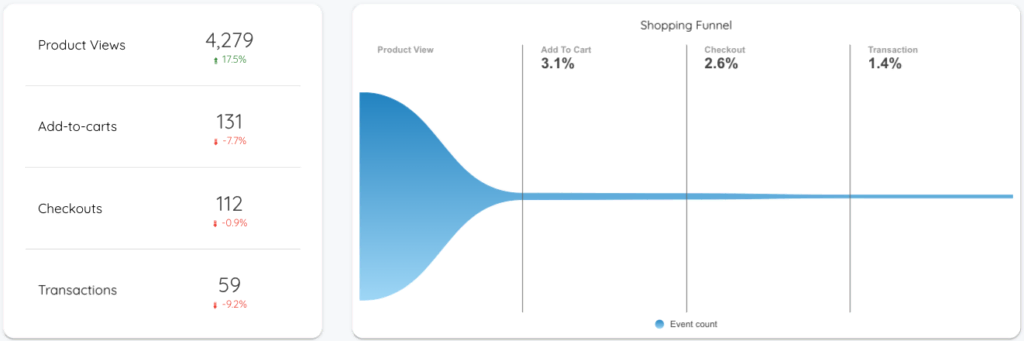
- Sales Funnel: Product Clicks, Product Views, Add to Cart, Checkouts, Transactions
Common dimensions to analyze your funnels, are time (day/week/month), country, device, browser, and marketing channel.
You can also create new calculated metrics, such as drop-off ratios, using Looker Studio’s calculated fields to advance your analysis.
What Data Sources to use in Funnel Charts
To connect your funnel with releavant data courses, first add them to Looker Studio. Below you will find some common data sources you can use for your funnel:
- Google Analytics (to present your website and ecommerce data)
- Google Ads / Facebook Ads (to connect your ads data with the commercial activity)
- Google Search Console (to incorporate the organic search demand in your funnel)
- Back-end Data Sources such as Shopify and Woocommerce (to combine your actual sales data with the rest data source).
How to Optimize Your Marketing Funnel?
There are several ways you can optimize your marketing funnel. Here are some ways you can improve your performance and make more sales:
- Create brand awareness using the same brand messages across the touchpoints of your funnel.
- Use your SEO and SEM strategy to generate more new leads with optimize landing pages.
- Use newsletters to increase customer interaction with your products and services.
- Product reviews, testimonials, and free trials can help you build trust.
- Discounts and limited time offers can help you increase the conversion rates lower in funnel.
Where to Find Ready-to-Use Marketing Funnel Reports?
Data Bloo offers ready-to-use marketing funnel reports such as Conversion Funnel Template, GA4 Template, and Website Master Template that you can use to visualize your data. You can use these templates to make a stunning report in a few easy steps and then use various charts and funnels to monitor your data.
Our marketing templates are not only comprehensive, but they can also make your reports visually pleasing. You can build a marketing funnel on Google Looker Studio using our templates in a few easy steps.