Table of Contents
Did you know that the amount of data created daily is estimated to be 1.1 trillion MB?
Data analysis is a crucial component of modern business operations. It enables businesses to make data-driven decisions and learn more about their operations.
However, a large number of businesses continue to underinvest in analytics solutions. As a result, despite continually producing and discovering new information, they are not always using it effectively.
A company can increase productivity, maximize profits, or make more strategically sound decisions using data analytics. Google Looker Studio Explorer enables you to analyze your critical data creatively. In this article, we explain how you get the most out of it, improving your day-to-day data analysis.
What Is Google Looker Studio Explorer?
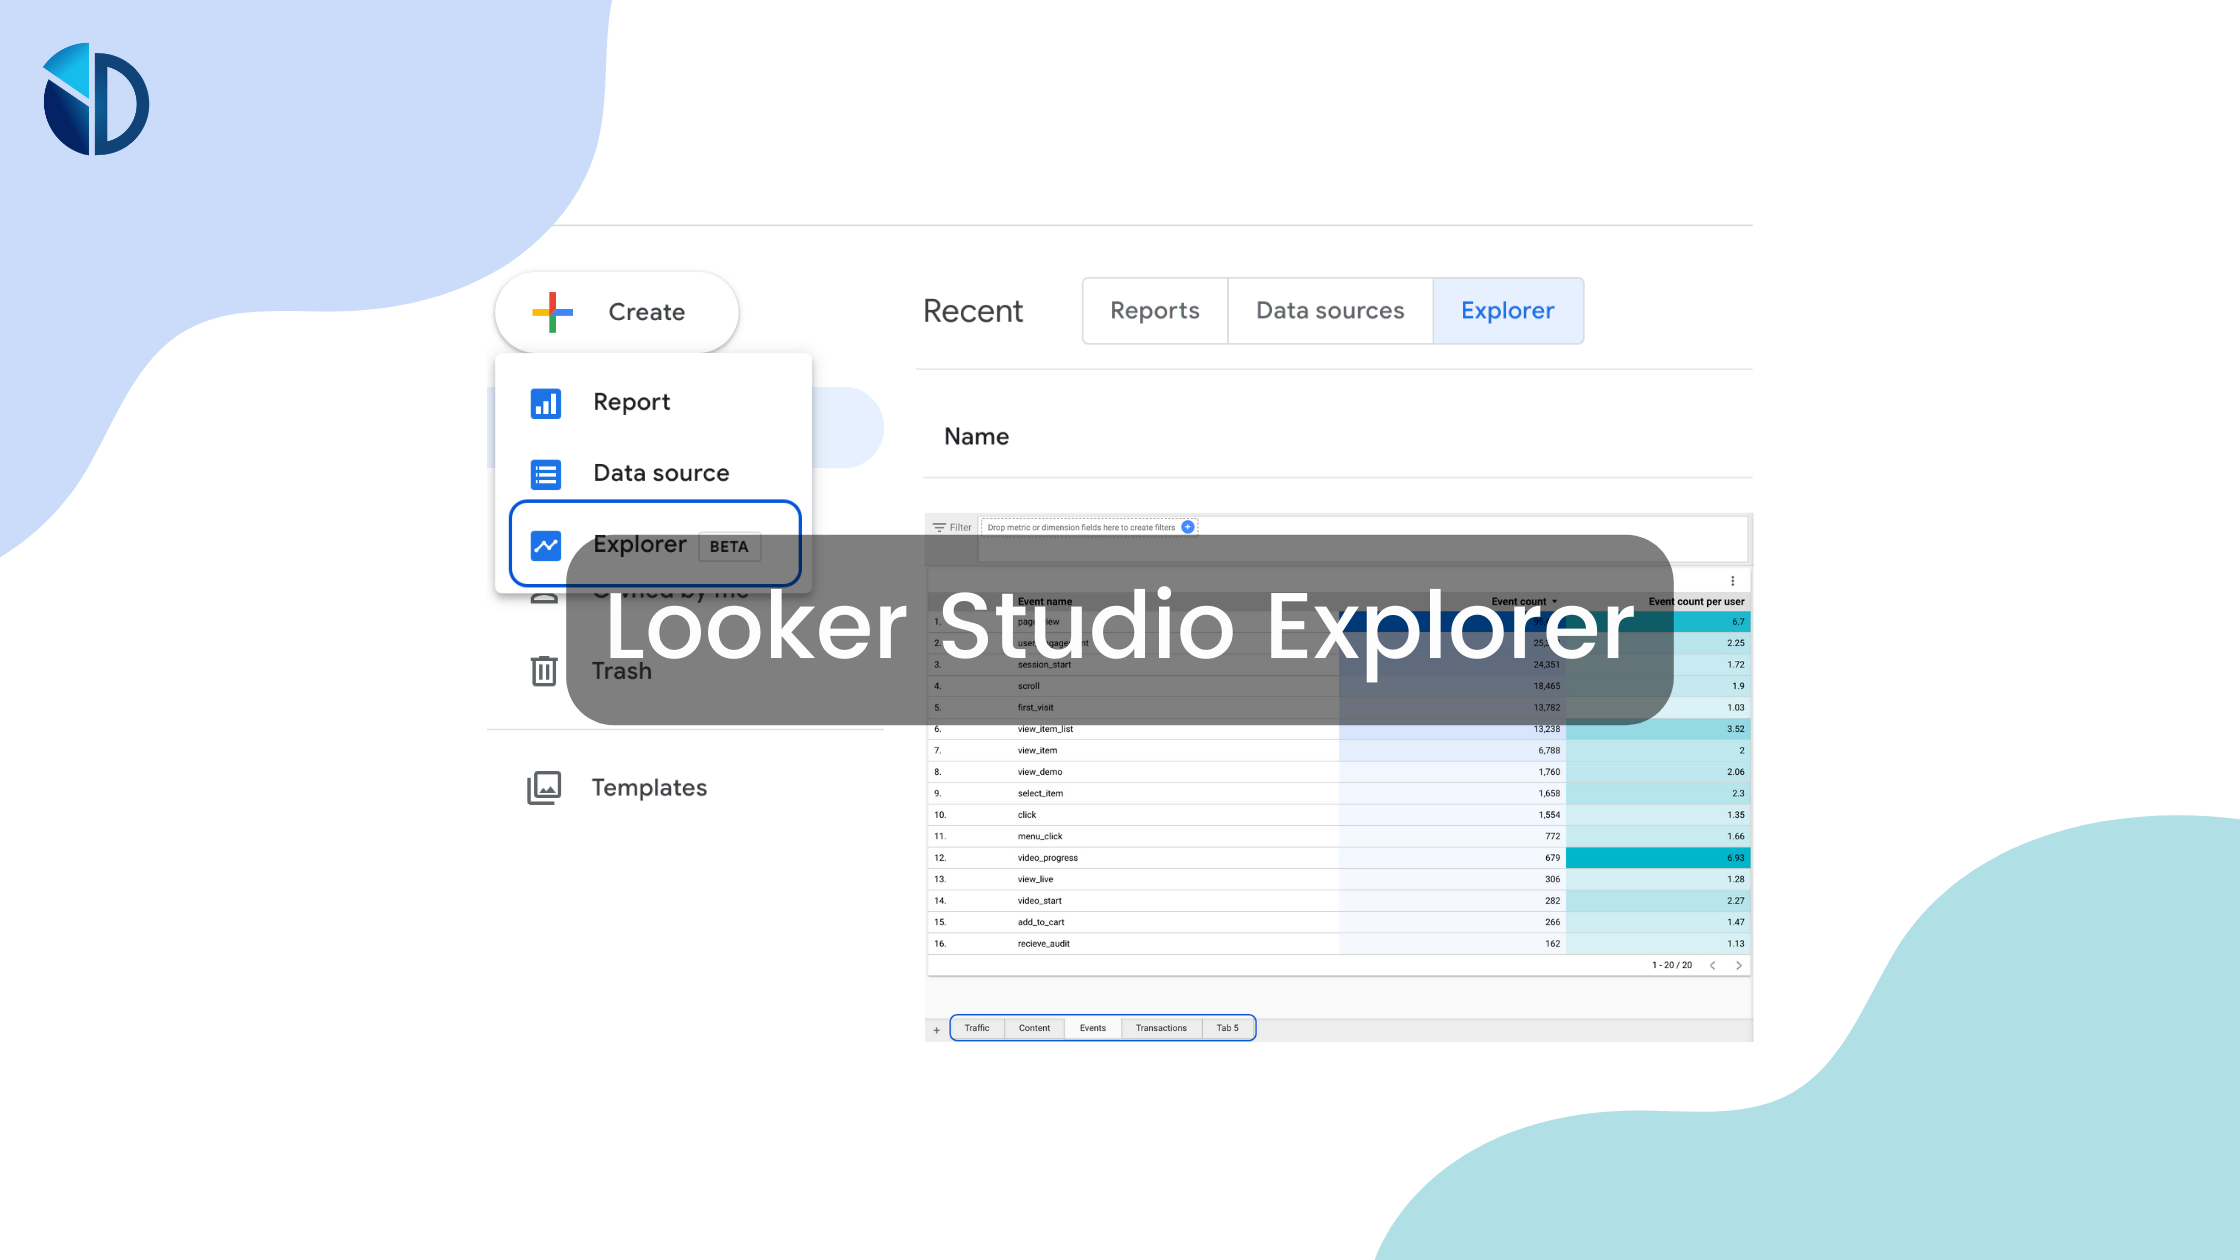
Looker Studio Explorer is a powerful data analysis tool that allows users to perform ad-hoc analysis. With its intuitive interface, similar to Looker Studio reports, users can easily play around with their data and work on multiple explorations simultaneously. It offers a temporary workspace and the ability to filter data sets, so anyone can easily focus on a subset of information.
Differences Between Explorer and Reports
As mentioned above Explorer functions very much just like the Reports in Google Looker Studio. However, there are two main differences:
- Explorations need to be saved to not be temporary (vs reports are automatically saved)
- Users cannot share Explorations like they can with Reports (only if a user export a visual to a report and then shares the report with others)
These features make it possible for users to work more efficiently and productively and to gain insights into their data faster.
Accessing Looker Studio’s Explorer
Getting into Looker Studio’s Explorer is super easy because it’s been integrated into the main environment.
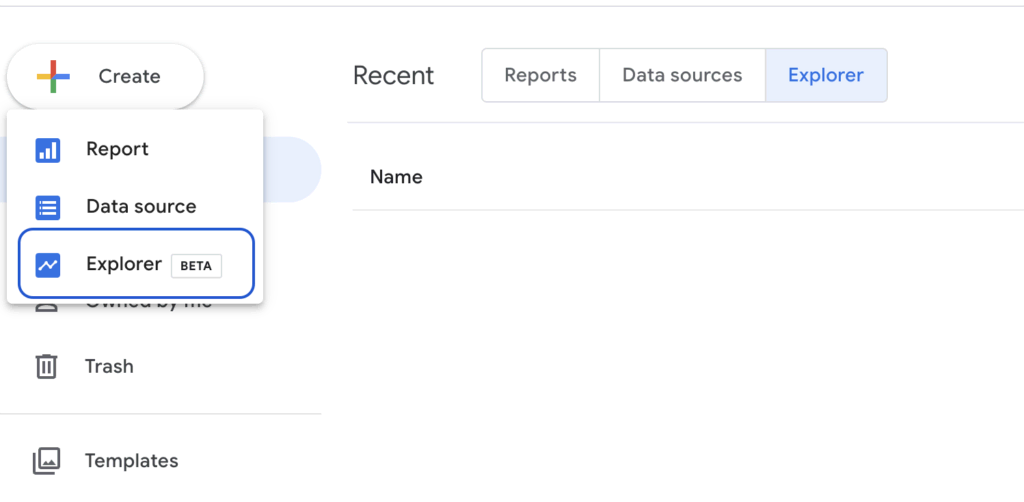
Once you have signed into Looker Studio, simply click “Explorer” on the left. From there, click the rainbow-colored plus sign to select a new data source. You can then select which data source you want to use as well as other customizations like chart types and different metrics filters.
5 Elements of Looker Studio Explorer
1) Ad-Hoc Analysis in a Temporary Workspace
Looker Studio Explorer allows users to perform ad-hoc analysis in a temporary workspace quickly. So, users can look into things without changing the data of any existing report or affecting other users’ work.
The temporary workspace feature enables users to experiment and test different scenarios without committing to any changes.
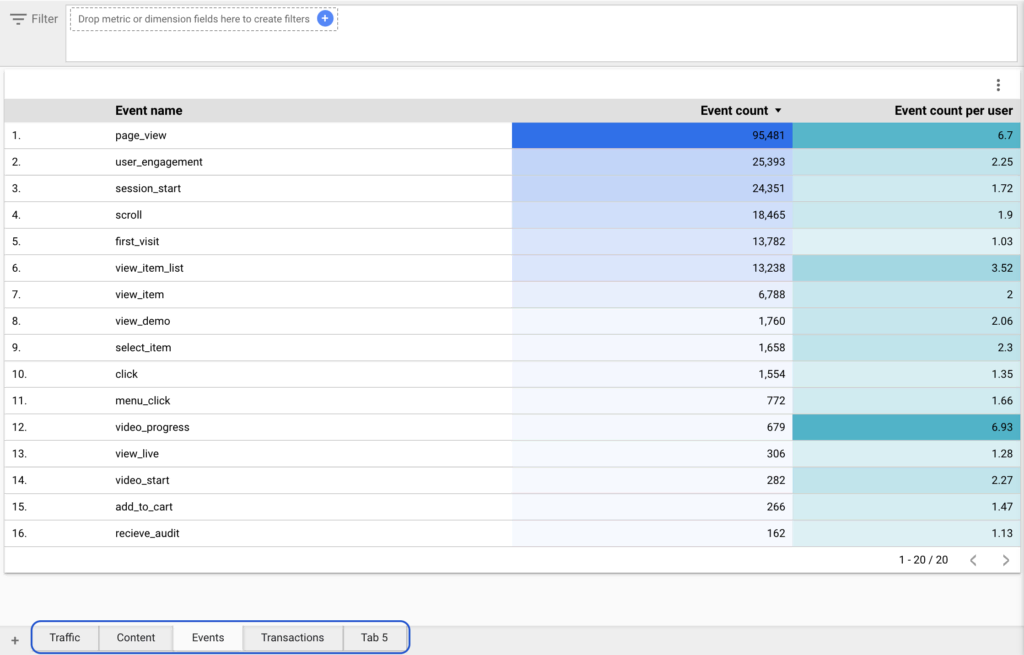
2) Multiple Tabs for Simultaneous Explorations
Explorer offers multiple tabs where users can work on other explorations simultaneously. This feature allows users to switch between different explorations and compare the results, making the process of data analysis more efficient and productive.
3) Intuitive Environment
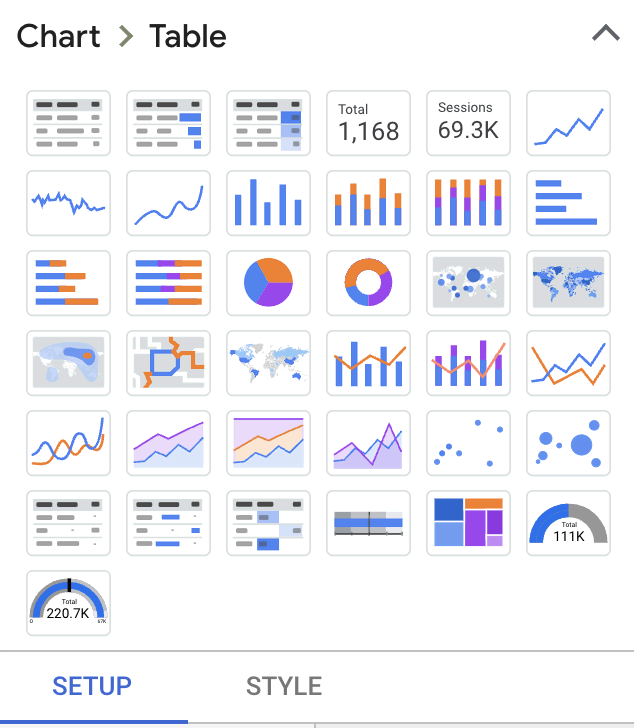
Looker Studio Explorer provides an intuitive environment that makes data analysis accessible and user-friendly. The tool provides the same chart controls and design elements of Looker Studio reports. This makes it easy for any user that is familiar with Looker Studio, to create and customize charts and graphs. Additionally, it allows users to focus on the data analysis rather than learning a new set of controls.
4) Data Filtering
Data filtering is an essential component of data analytics. Looker Studio Explorer provides powerful data filtering capabilities. It allows users to segment their data and focus on a specific part of it.
Users can easily filter data based on specific criteria, such as date ranges or dimensions (i.e. product categories) or metrics (i.e. sales over 100). This functionality allows the user to isolate particular areas of interest.

5) Import Feature
The explore feature in your Looker Studio reports allows users to import charts and graphs into Explorer. This element helps you import a chart from any existing report and focus on the drill-down analysis of this area. By doing that you can save a lot of time and focus on your analysis and insights.

Benefits of Using Looker Studio Explorer
Google Looker Studio Explorer provides instant data visualization and insights. This enables users to gain insights into their data quickly.
The tool also offers increased efficiency in data analytics through its powerful features. This ultimately leads to better decision-making capabilities for quick wins.
Practice with Available Charts
It’s simple to grasp and practice data analysis with Looker Studio Explorer’s charts. The tool offers a wide range of chart types, among others, including the following:
- Tables & Pivot Tables
- Time Series
- Bar Charts
- Funnel charts
- Waterfall charts
- Maps
This lets users experiment with different chart types and find the one that best suits their needs.
Instant Data Visualization and Insights
Looker Studio Explorer is designed to provide instant data visualization and user insights. Users can quickly gain insights into their data thanks to its easy-to-use interface. Furthermore, it is easier to use the import feature that we mentioned above, to import charts and graphs from other reports.
Users can segment data and focus on specific subsets of information by using all the available filtering features. This enhances their ability to find quick answers and make informed decisions. In today’s fast-paced business world, it’s essential to be able to see and understand data quickly.
It is essential for business intelligence, where decisions must be made quickly and accurately.
Increased Efficiency in Data Analysis
Looker Studio Explorer increases efficiency in data analysis. It provides a range of powerful features and capabilities. The tool offers multiple tabs for:
- simultaneous explorations for comparing different data sources
- data filtering for segmenting your data sets
- live analysis of specific parts of a report using the import functionality (instead of exporting data to a CSV or spreadsheet)
Better Decision-Making for Quick Wins
Google Looker Studio Explorer is an excellent tool for business. It enhances decision-making capabilities by giving users instant data visualization and analysis tools. Users can gain valuable insights into their data in a timely and efficient manner.
These insights lead to better decision-making and improved business outcomes, such as quick wins on a campaign evaluation.
Using Explorer for Data Analysis
Nearly every industry uses data analytics. Data analytics helps companies identify client needs and enhance their products, services, and e-commerce, regardless of size or industry.
For example, as a business analyst, one of the most critical tasks is to understand business performance deeply. To achieve this, you need access to accurate and relevant data.
This is where Looker Studio comes in. It is a powerful data exploration platform that provides you with a wealth of information at your fingertips.
With a simple drag-and-drop functionality, a business analyst can quickly create visuals and do ad-hoc analyses. This enables your company to learn more about how business is doing. In addition, the data is presented in a way that is easy to navigate.
This allows the business analyst to dive deep into your data to uncover key insights and trends. You can also use filters and custom calculations to refine your analysis further.
Once he has found the answers he is looking for, he can choose to save his exploration for later or simply leave Explorer without saving. This gives him the flexibility to return to his analysis later, either to pick up where he left off or to revisit the insights he has uncovered.
Explore Your Data With Looker Studio Explorer
Google Looker Studio Explorer is essential for any business analyst looking to get the most out of their data. With its powerful data exploration capabilities and intuitive interface, you can quickly and easily gain the insights you need to drive better business outcomes.
So why wait? Start exploring your data today with Looker Studio Explorer! Contact us for templates to optimize, analyze and grow your online business.

