Table of Contents
Excel remains a popular data analysis tool, with over 1 billion users globally. To streamline data workflows, Looker Studio has recently introduced a native connector for Excel, allowing users to directly connect Excel files to Looker Studio. This integration enables easy-to-use data visualization and analysis without converting Excel files into Google Sheets or CSV formats.
In this guide, we will cover the basics of the Excel Looker Studio Connector, its importance, and benefits, as well as a step-by-step process to connect Excel with Looker Studio and practical examples to get the most out of this new feature.
What is the Excel Looker Studio Connector?
The Excel Looker Studio Connector is a native feature recently launched by Google in preview mode that enables analysts and business users to connect Excel documents directly from their local storage into Looker Studio. This allows users to upload Excel workbooks and visualize their data using Looker Studio’s powerful reporting and visualization tools. The connector supports the connection to a single worksheet in an Excel file and provides several configuration options to optimize data integration.

Why Connect Excel with Looker Studio?
Connecting Excel with Looker Studio improves data analysis and visualization capabilities. Unlike Excel’s basic charting features, Looker Studio offers advanced visualization tools, allowing you to create interactive dashboards with filters, custom navigation, and more.
This integration also saves time for those who used to converted Excel files to Google Sheets in order to visualize their data on Looker Studio.
Additionally it allows you to unify multiple sources under one place. For example, you can blend backend sales data from Excel with Google Analytics data in Looker Studio to analyze performance across various metrics in a single report.
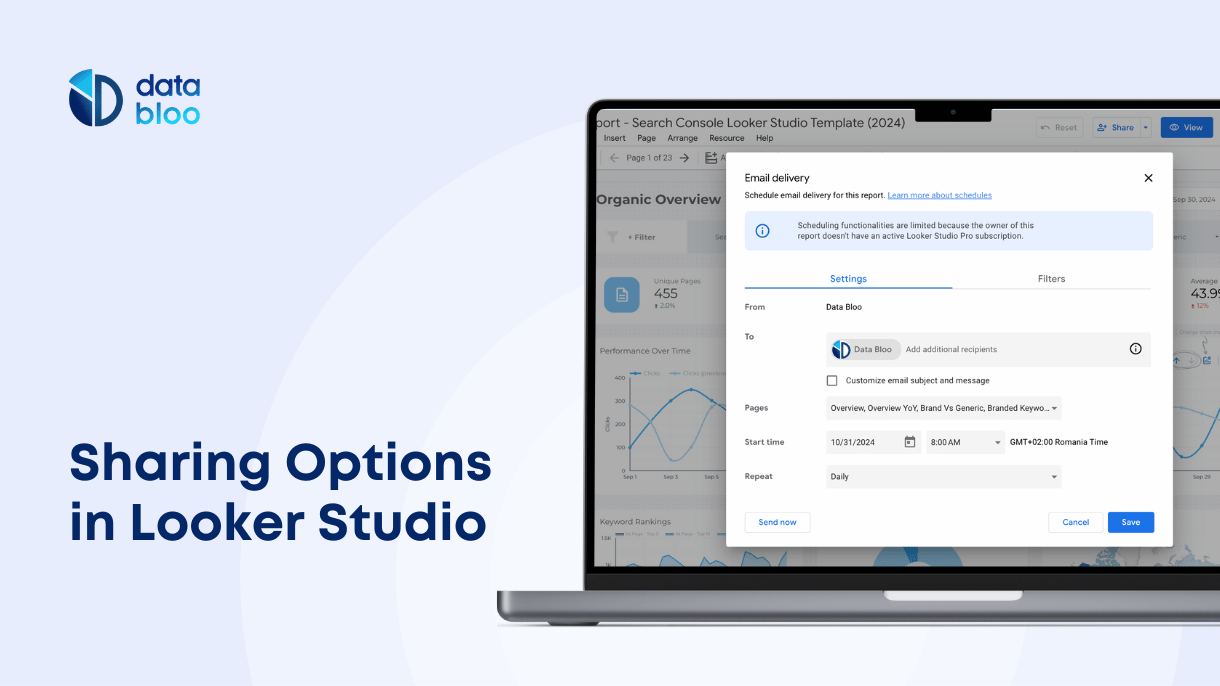
Lastly, Looker Studio facilitates collaboration by making it easy to share Excel-based reports, schedule automated email reports, and set alerts to ensuring on time analysis and decision making.
How to Connect Excel with Looker Studio
To connect an an Excel file to Looker Studio is a pretty straightforward process. To do that follow these steps:
- Sign in to Looker Studio: Go to the Looker Studio homepage and log in with your credentials.
- Create a New Data Source: Click the “Create” icon and select “Data Source.”
- Select the Excel Connector: Choose the “Microsoft Excel” connector from the list of available connectors.
- Upload Your Excel File: Browse and select the Excel file you want to connect.

- Configure Data Source Options:
- Use the first row as headers.
- Include or exclude hidden and filtered cells.
- Specify a range of cells or select rows and columns to skip.

- Connect the Data Source: Click “CONNECT” in the upper right to link your data source to Looker Studio.
- Configure Data Fields: Use the data source fields panel to rename fields, add descriptions, create calculated fields, and adjust data types and aggregations.

- Control Data Access: Set the data credentials to “Owner’s Credentials” so anyone with the link to your report can view the data.
- Create Reports: Click “CREATE REPORT” to start building visualizations using your newly connected Excel data.

Current Limitations of the Excel Connector
While the Excel connector is a powerful addition to Looker Studio, there are some limitations to be aware of:
- File Size Limit: Maximum supported file size is 100 MB.
- Column Limit: Up to 10,000 columns per Excel sheet are supported.
- Unsupported Features: Password-protected files, macros, and pivot tables are not supported.
- Data Uniformity: All cells within a column must be of the same data type.
Practical Examples of Using Excel Data in Looker Studio
- Sales Data Analysis: Download sales data from your CRM or ERP system as an Excel file, upload it to Looker Studio, and visualize sales trends, customer segmentation, and revenue growth.
- Financial Reporting: Use Excel sheets for financial statements, connect them to Looker Studio, and create dynamic financial dashboards for CFOs and stakeholders.
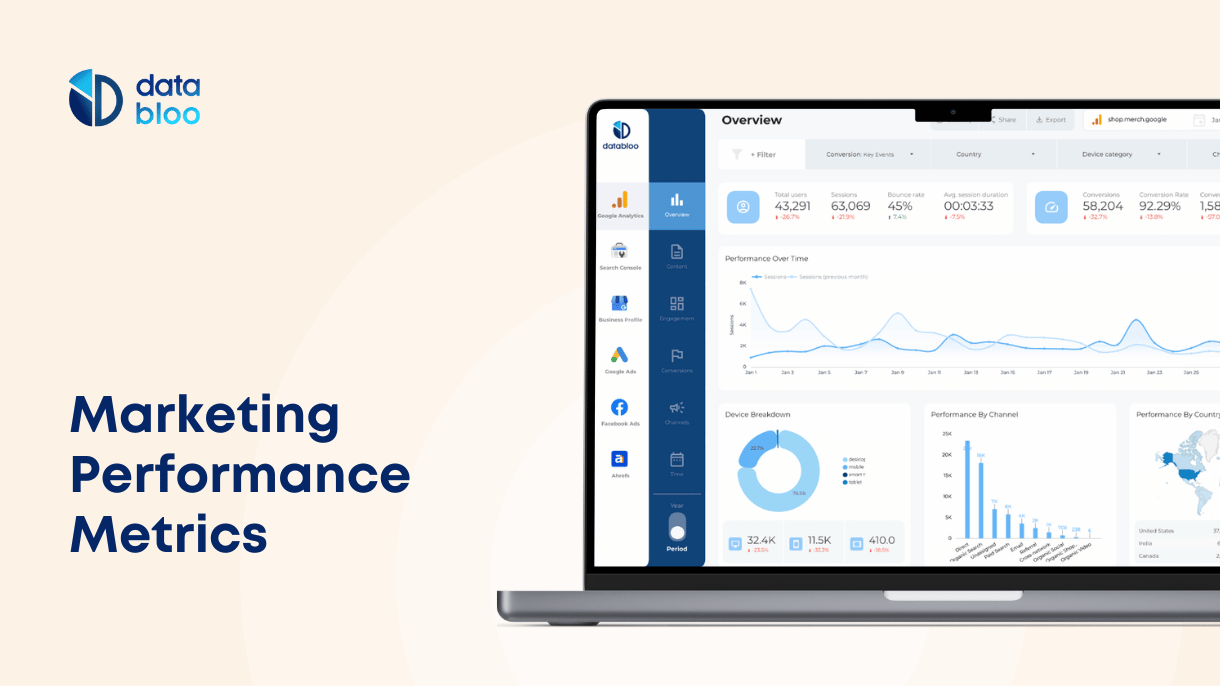
- Marketing Performance: Import Excel files containing digital marketing metrics (e.g., ad performance, SEO data like crawled pages) and analyze the results alongside other marketing channels in Looker Studio.
- Project Management: Upload project tracking data from Excel to visualize project timelines, resource allocation, and task completion rates.
- Survey Data Visualization: Connect survey results stored in Excel to Looker Studio to create interactive charts and reports, making insights more accessible and engaging for all stakeholders.
Make the Most of Your Data with Looker Studio and Excel
The Excel Connector in Looker Studio provides a seamless integration between Excel and Looker Studio, unlocking new opportunities for data visualization and analysis. By connecting these tools, organizations can enhance their reporting capabilities, improve collaboration, and make data-driven decisions more efficiently. As this feature continues to develop, Looker Studio users can expect even more advanced functionalities and integrations.
Integrating Excel with Looker Studio enhances your data analysis by offering better visualization tools, streamlined workflows, and improved collaboration with your stakeholders. By combining Excel data with other sources like web analytics and campaigns’ data in Looker Studio, you can create comprehensive reports that provide deeper insights. This integration makes it easier to share, automate, and analyze data, helping your team make faster decisions.