Table of Contents
In July 2024, Google announced the introduction of Gemini AI in Looker Studio, a powerful tool designed to revolutionize data analysis and business reporting. This new feature integrates AI-driven capabilities into Looker Studio, making data interaction more intuitive and accessible for people who lack advanced technical knowledge like creating formulas using regular expression.
In this article, you will learn about what Looker Studio Gemini AI is, how to set it up, and its main capabilities up until now, including the Formula Assistant, Google Slides integration and Conversational analytics. We will also explore practical examples to help you get the most out of Looker Studio and Gemini AI.
What is Gemini AI in Looker Studio?
Gemini in Looker Studio is an AI-powered feature designed to simplify data analysis and enhance reporting capabilities. Available only to Looker Studio Pro users, Gemini provides conversational analytics, allowing users to interact with their data as naturally as chatting with another person. This integration makes data interpretation accessible and efficient across organizations. Apart from conversational analytics, Gemini enables easy integration of Looker Studio assets like charts and graphs with Google Slides at the click of a button.

How to Set Up Gemini in Looker Studio
To enable Gemini in Looker Studio, follow these steps:
- Subscribe to Looker Studio Pro: Ensure you have a Looker Studio Pro subscription, as Gemini AI is available only to paid users.
- Enable Gemini: To activate Gemini AI, you must have the proper permissions in your Google Cloud Project (Owner or Looker Studio Pro Manager for self-service subscription). Open Google Looker Studio, click the configuration icon, navigate to Gemini in Looker, and enable the feature for your project.
- Access Gemini AI: Once activated, open a report that is owned by your organization and the new feature will be displayed on the right side (under the data, properties, and filter bar).

Main Features of Gemini AI in Looker Studio
As a new feature in Looker Studio, Gemini AI promises to continually evolve, with Google expected to add more functionalities over time. For now, Gemini offers two main capabilities that significantly improve data analysis and reporting:
Formula Assistant
The Formula Assistant feature in Gemini helps users create calculated fields without needing extensive knowledge of Looker Studio’s formula language. This tool simplifies complex data manipulations like regex by allowing users to input natural language prompts.
Google Slides Integration
Gemini enables users to connect Looker Studio components directly with Google Slides, facilitating the creation of presentations. This integration helps streamline the process of sharing insights with internal and external stakeholders, ensuring that data remains up-to-date.
Conversational Analytics
Another powerful capability of Gemini AI in Looker Studio is Conversational Analytics, which allows users to interact with their data using natural language. Instead of manually configuring reports, you can ask questions directly, and Looker Studio will generate charts or data tables in response. This feature simplifies data analysis, making insights more accessible even for non-technical users like marketers and analysts.
Now let’s see how to use each of these AI features in Looker Studio.
How to Use the Formula Assistant
The Formula Assistant in Gemini allows you to create complex formulas using simple, natural language prompts. Based on your input, Gemini AI suggests a formula for a calculated field using your data source’s metrics and dimensions. Here are five practical examples:
1) Channel Grouping
Prompt: Define basic channel grouping for social and organic.
Output: CASE WHEN REGEXP_MATCH(Medium, “.social.|.facebook.|.twitter.“) THEN “Social” WHEN REGEXP_MATCH(Medium, “.organic.|.seo.“) THEN “Organic” ELSE “Other” END
2) Brand Terms
Prompt: Define brand and generic keywords based one these brand terms data bloo and databloo.
Output:CASE WHEN REGEXP_MATCH(Query, “.*data bloo.*|.*databloo.*”) THEN “Brand Query” ELSE “Generic Query” END
3) Keyword Ranking
Prompt: Bucket average position in groups of 4 (top 3, top 10, top 20, rest)
Output: CASE WHEN Position <= 3 THEN “Top 3” WHEN Position > 3 AND Position <= 10 THEN “Top 10” WHEN Position > 10 AND Position <= 20 THEN “Top 20” ELSE “Rest 21+” END
4) Customer Segmentation
Prompt: Identify high-value customers (spending over $1000)
Output: CASE WHEN Total_Spending > 1000 THEN “High-Value Customer” ELSE “Regular Customer” END
5) Customer Segmentation
Prompt: Create age groups (18-24, 25-34, 35-44, 45-54, 55-64, 65+)
Output: CASE WHEN Age >= 18 AND Age <= 24 THEN “18-24” WHEN Age >= 25 AND Age <= 34 THEN “25-34” WHEN Age >= 35 AND Age <= 44 THEN “35-44” WHEN Age >= 45 AND Age <= 54 THEN “45-54” WHEN Age >= 55 AND Age <= 64 THEN “55-64” ELSE “65+” END
These examples demonstrate how the Formula Assistant makes it easier to create calculated fields using a simple prompt. This feature allows even beginners to dig deeper into their data and create the corresponding fields to present better stories based on this data.
How to Connect Google Slides with Looker Studio
Creating presentation with up-to-date data is crucial for marketers. With the introduction of Gemini AI, you can now connect Looker Studio with Google Slides easily. This feature simplifies the process of creating and sharing data stories with your shareholders. Here’s how to set it up:

- Open Looker Studio Report: Navigate to the report you want to use.
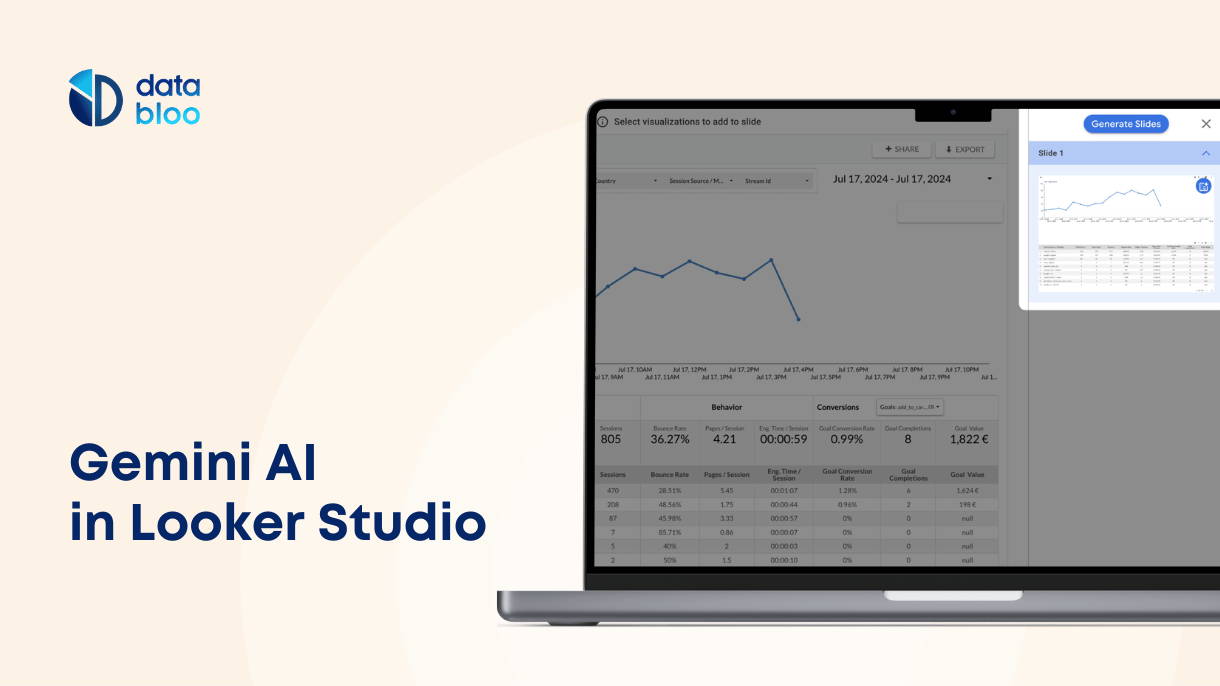
- Access Gemini Panel: Open the Gemini panel and select “Generate Slides.”
- Select Charts: Choose the visualizations you want to include in your Slides presentation. You can pick all the components of a page or specific charts.
- Create Slides: Click “Create Slides” to generate the presentation.
Once created, you can explore the actual power of AI, allowing you to access descriptive narratives for the charts that you have selected, complete with comments and notes generated based on these numbers.

Let’s dive deeper into this AI feature and see some practical examples of how to use them effectively.
Practical Examples of Using Google Slides Integration
- Sales Performance Review: Use Looker Studio visualizations to create a sales performance presentation, updating slides automatically as data changes.
- Marketing Campaign Analysis: Generate slides to showcase the performance of marketing campaigns, including metrics like impressions, clicks, and conversions.
- Quarterly Business Reports: Automatically create quarterly business review presentations with the latest data, ensuring stakeholders always have up-to-date information.
- Client Reporting: Create tailored client reports with specific data visualizations, making it easy to communicate performance metrics and insights.
- Team Meetings: Use real-time data visualizations in team meetings to discuss performance, identify trends, and make better decisions.
How to Use Conversional Analytics in Looker Studio
To use Conversational Analytics, you need to connect your data sources to Looker Studio. This feature is compatible with:
- Google BigQuery
- Google Sheets
- CSV files
- Extracted data for faster performance
- Looker data connectors
Setting up these connections ensures you can leverage Conversational Analytics for deeper insights. You can follow the specific setup guides for each data source, such as connecting to BigQuery, importing Google Sheets, or uploading CSV files to Looker Studio.
Access Conversational Analytics in Looker Studio
You can access Conversational Analytics in different ways:
- Navigate directly to the Conversational Analytics page in Looker Studio.
- Select “Conversational Analytics” from the navigation panel.
- Choose “Conversation” from the Create menu if you’re working within the Sandbox workspace.

Types of Questions You Can Ask
Conversational Analytics supports a range of queries that can be answered with one chart, such as:
- Trends of a metric over time (e.g., “Show revenue growth in the last 6 months”)
- Distribution of a metric by category (e.g., “Break down sales by product category”)
- Unique values for specific dimensions (e.g., “List all campaign sources”)
- Single metric values (e.g., “Total revenue for Q1 2024”)
- Top-performing dimensions (e.g., “Top 5 countries by sales“)
However, some advanced questions are not yet supported, including:
- Period-over-period analysis (e.g., “Compare revenue month-over-month”)
- Predictive analysis and forecasting
- Advanced statistical calculations (e.g., correlation analysis, anomaly detection)
For best results, keep questions straightforward and focus on insights that can be represented in charts or tables.
Improve Your Reporting with Gemini AI
Looker Studio Gemini AI revolutionizes the way you interact with data, making it easier to analyze and present insights. From creating calculated fields with the Formula Assistant to integrating Looker Studio reports into Google Slides and interacting with data using natural language, Gemini offers powerful tools to enhance your data-driven decision-making processes. For a deeper dive into these features, explore our templates and resources tailored to optimize your Looker Studio experience. Visit databloo.com to discover more.