Table of Contents
Efficient data categorization and analysis are crucial for making better decisions for your business. Google Looker Studio has introduced a new feature called “bins” that significantly enhances your ability to group and analyze data without using complex coding and regular expressions. This article will walk you through what Looker Studio bins are, how they work, and how to use them in your reports. By the end, you’ll be able to utilize bins to create insightful visualizations and reports on Looker Studio.
What are Looker Studio Bins?
Looker Studio bins allow you to create ad hoc numeric tiers for dimensions without needing to create logical expressions. This feature simplifies the process of grouping similar data points into specific integer ranges, making it easier to adjust the granularity of your data and perform detailed analysis. Whether you want to categorize age groups, sales quantities, or revenue segments, bins provide a flexible and user-friendly solution. With bins anyone can get a sense of their data’s distribution and easily spot trends.
How Looker Studio Bins Work
Bins in Looker Studio function by creating numeric tiers for your data, allowing you to quickly group values into specific ranges. You can choose between equal-sized bins or custom-sized bins depending on your analysis needs.
- Equal-Sized Bins: These bins group numeric values into intervals of equal size. For example, if you are analyzing age groups, you might create bins of equal size such as 18-25, 26-33, 34-41, etc. Each bin covers the same range of values, making it easier to compare data across evenly distributed categories.
- Custom-Sized Bins: These bins allow you to define intervals of varying sizes based on specific needs. For example, when analyzing revenue, you might want more granular bins for lower revenue ranges and broader bins for higher revenue ranges, such as $0-$100, $101-$500, $501-$1000.

How to Create Bins in Looker Studio
Using Looker Studio Bins is straightforward. This feature is particularly useful for creating histograms or other charts that require data to be categorized into discrete intervals.
You can create a bin in Looker Studio either directly in your data source or within a report. The difference is that in the first scenario, the bin is reusable across any report that uses the specific data source. In the second option, within a report, the bin lives only in the embedded data source for that specific report. To use the bin across multiple reports, you should change the data source type from embedded to reusable. Here you will find more information about the differences between data source types.

To create a bin directly you can follow these steps:
- Open the report: Open the report in which you want to create the bin. Ensure you have edit rights to the report and its data source.
- Edit the data source: Go to Edit mode, then from the main menu, go to Resource > Manage added data sources > Edit your data source.
- Add a bin: Click “Add a Field” at the top right and then select “Add bin”.
- Select field: Choose an existing field from your data source to bin by from the drop-down menu. For example, you can select a metric like sales or revenue.
- Name and ID: Provide a unique name for your bin and optionally edit the default ID.
- Refresh field info: Optionally, click “Refresh field info” to get field values and estimate the min and max values.
- Specify bin type: Choose between “Equal Sized” or “Custom Sized” bins.
- Equal Sized: Bin numeric values into equal integer ranges (e.g., 0-10, 10-20). Define the bin size (e.g., 10) and the min and max values (e.g., 0 and 100).
- Custom Sized: Create custom bin sizes of varying integer ranges (e.g., 0-15, 15-75). Define the bin breakpoints to group your data accordingly (e.g., 15, 50, 75).
Practical Examples of Using Looker Studio Bins
Here are some practical examples of how to use Looker Studio Bins to enhance your data analysis:
1. Grouping Sales Revenue Ranges
Group sales revenue into predefined bins to quickly analyze different revenue segments without writing complex expressions.
Configuration Example:
- Bin Name: Revenue Ranges
- Field to Bin By: Total Revenue
- Bin Type: Custom Sized
- Bin Ranges: $0-$500, $501-$1000, $1001-$1500
2. Creating Age Groups
Create bins for age groups to easily segment and analyze demographic data in your reports.
- Bin Name: Age Groups
- Field to Bin By: Age
- Bin Type: Equal Sized
- Bin Ranges: 18-25, 26-35, 36-45, etc.
3. Categorizing Session Duration
Group session durations into bins to analyze how long users stay on your site.
- Bin Name: Session Duration
- Field to Bin By: Session Duration
- Bin Type: Equal Sized
- Bin Ranges: 0-30 seconds, 31-60 seconds, 61-120 seconds
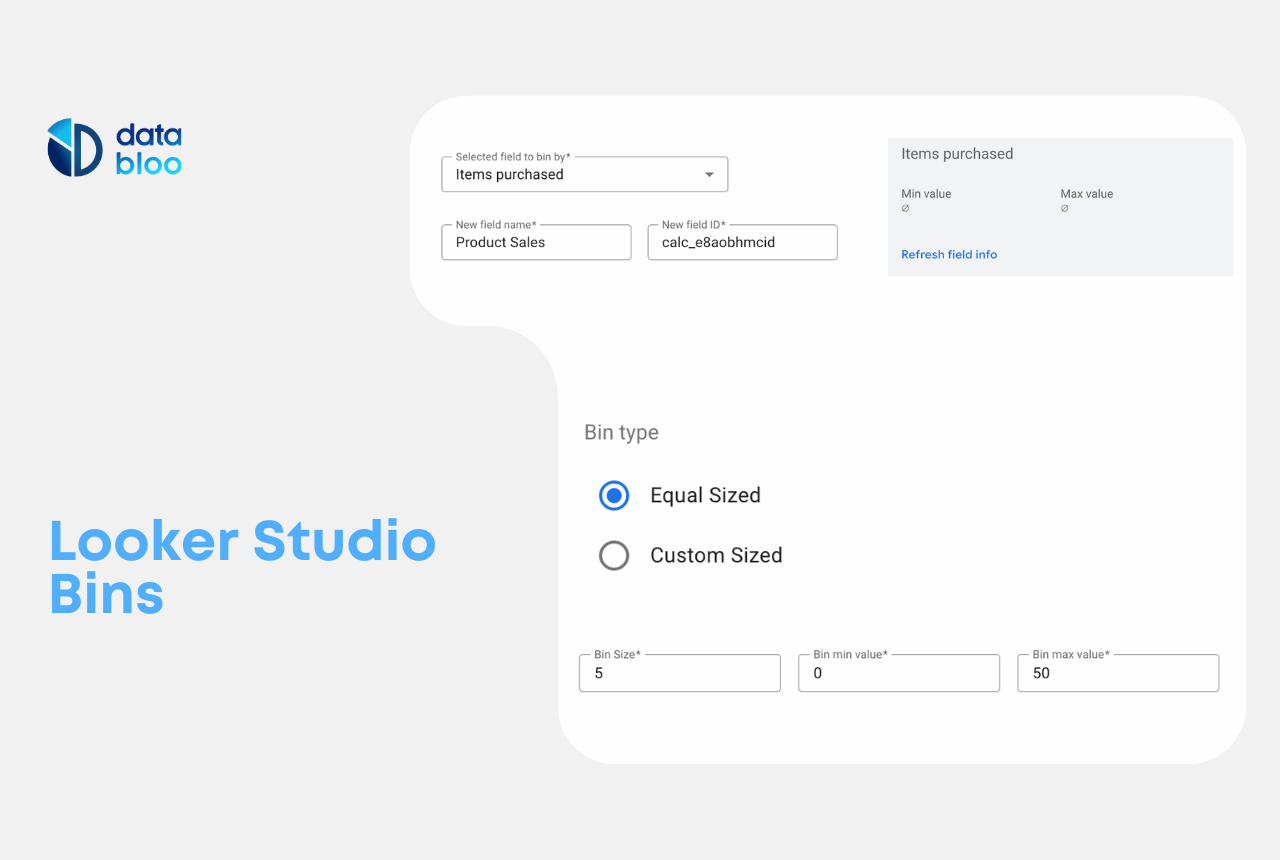
4. Segmenting Order Quantities
Segment order quantities into bins to quickly assess order distribution and identify trends.
- Bin Name: Product Sales
- Field to Bin By: Items purchased
- Bin Type: Equal Sized
- Bin Ranges: 0-5, 5-10, 10-15 etc.

5. Analyzing Product Price Ranges
Group product prices into bins to analyze different price segments and their performance.
- Bin Name: Product Prices
- Field to Bin By: Price
- Bin Type: Custom Sized
- Bin Ranges: $0-$50, $51-$100, $101-$200
Conclusion: Enhance Your Data Analysis with Looker Studio Bins
Looker Studio Bins provide a powerful and flexible way to categorize and analyze your data without complex coding. By utilizing bins, you can create insightful visualizations and reports that help you make informed business decisions. For a more detailed and customized reporting experience, explore Data Bloo’s template resources designed to enhance your Looker Studio capabilities.