Table of Contents
Google Ads is a powerful tool that businesses use to get noticed online on search, youtube and other places and attract the right kind of visitors to their websites. The success of Google Ads campaigns is often measured using Key Performance Indicators (Google Ads KPIs). These are like metrics that tell you how well your ads are doing.
Understanding these metrics is essential because they help you figure out what’s working and what’s not, allowing you to make your ads better and more effective.
While some people might only look at basic scores like how many people click on their ads or how much each click costs, it’s a good idea to look at more detailed performance indicators. This can give you a clearer picture of how your ads are performing and what you can do to improve them.
What are KPIs in Google Ads and Why are They Important?
KPIs, or Key Performance Indicators, are like the vital signs for your Google Ads campaigns. They tell you how healthy your campaign is and whether it’s performing well or needs some attention. In the context of Google Ads, these indicators help you understand if you’re getting your money’s worth from your ads and what kind of impact they have on your target audience.
Firstly, it’s important to know what these KPIs are and what they represent in your campaigns. Think of KPIs as specific targets you want your campaign to achieve. These could range from getting more people to click on your ads (Click-Through Rate) to making sure you’re not spending too much for those clicks (Cost Per Click) or ensuring that people take the desired action once they visit your site (Conversion Rate).
Making Strategic Decisions Based on KPIs
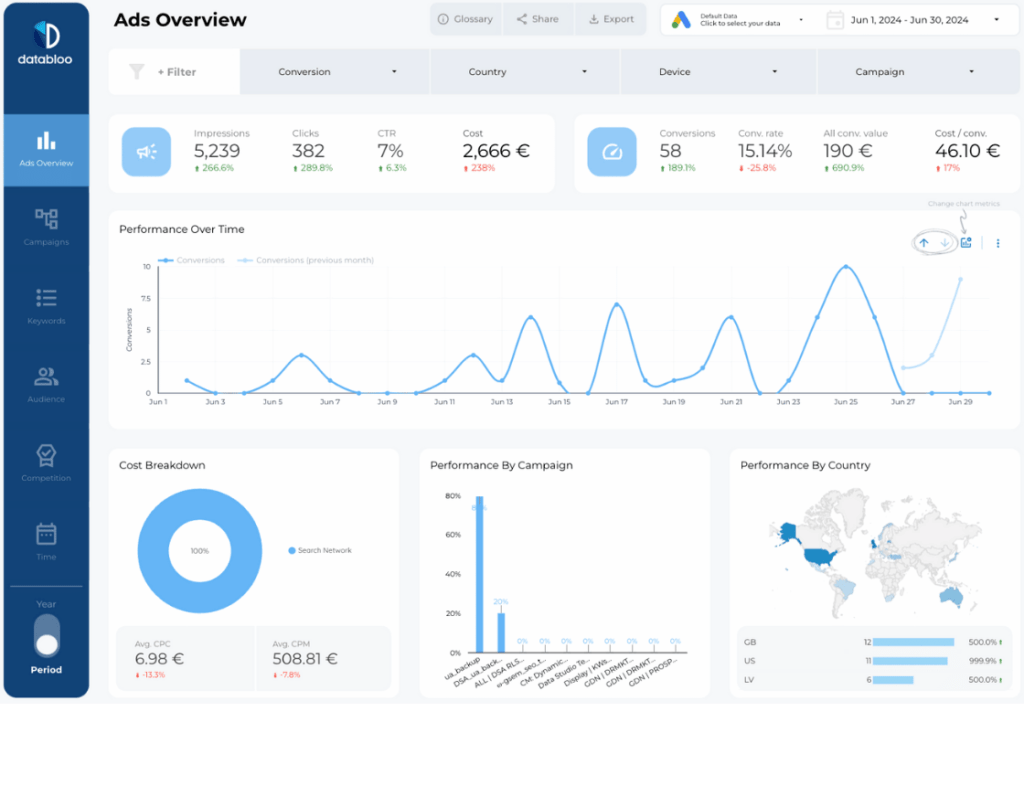
Knowing your KPIs helps you make smart decisions. For example, if you see that your Click-Through Rate is high but your Conversion Rate is low, it might mean your ads are promising one thing, but your landing page is delivering something else. This insight allows you to make necessary adjustments to align your ads and landing pages better.
Choosing the Right Google Ads KPIs for Your Campaigns
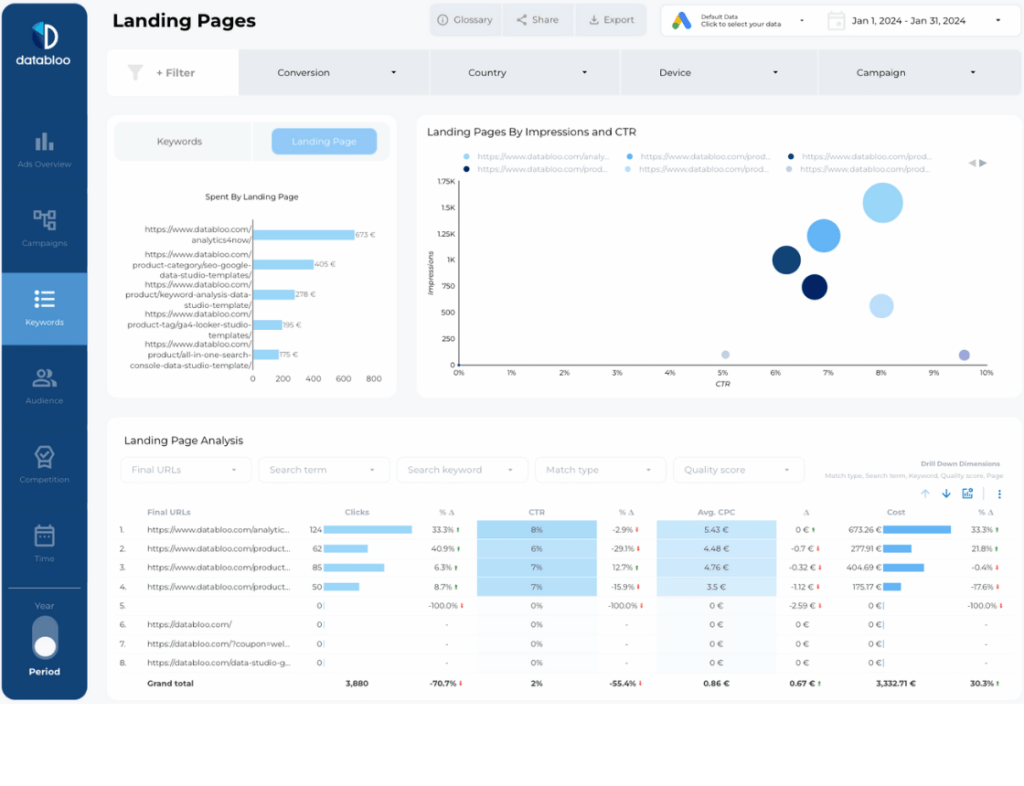
When it comes to Google Ads, not all KPIs are created equal. The KPIs you choose to focus on should align with your specific business goals and the objectives of your advertising campaigns. Here’s how you can select the right KPIs for your needs:
Align KPIs with Business Goals
Start by clearly defining your business goals. Are you aiming to increase online sales, generate leads, boost website traffic, or enhance brand awareness? Your goal will determine which KPIs are most relevant. For instance, if you’re focused on sales, you’ll want to pay close attention to Conversion Rate and Return on Ad Spend (ROAS).

Consider Your Campaign Objectives
Different types of campaigns have different objectives. A brand awareness campaign might focus on Impressions and Reach, while a lead generation campaign might prioritize Conversion Rate and Cost Per Action. Ensure your KPIs reflect the specific objectives of each campaign.

Understand Your Target Audience
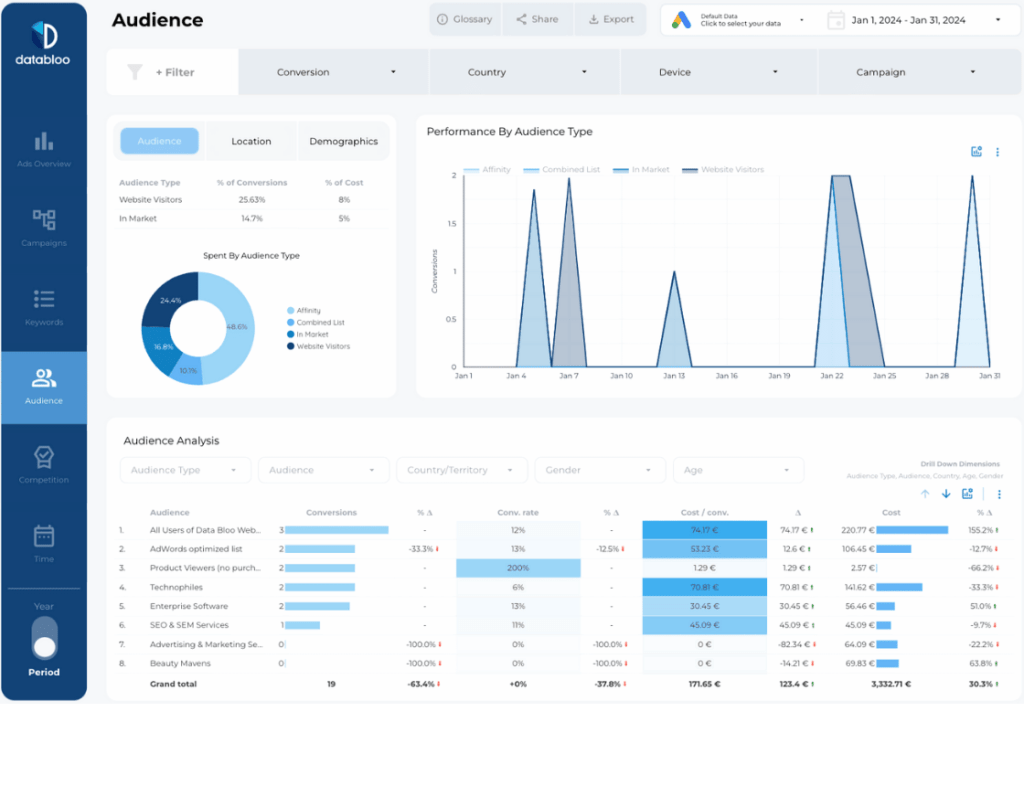
Your audience’s behavior and how they interact with your ads can also influence which KPIs are most important. For example, if you’re targeting a tech-savvy audience with interest in Enterprise Softwares and Digital Marketing Services, you might focus on engagement metrics like Click-Through Rate or Conversion Rate.
Maintain a Balanced Mix of KPIs
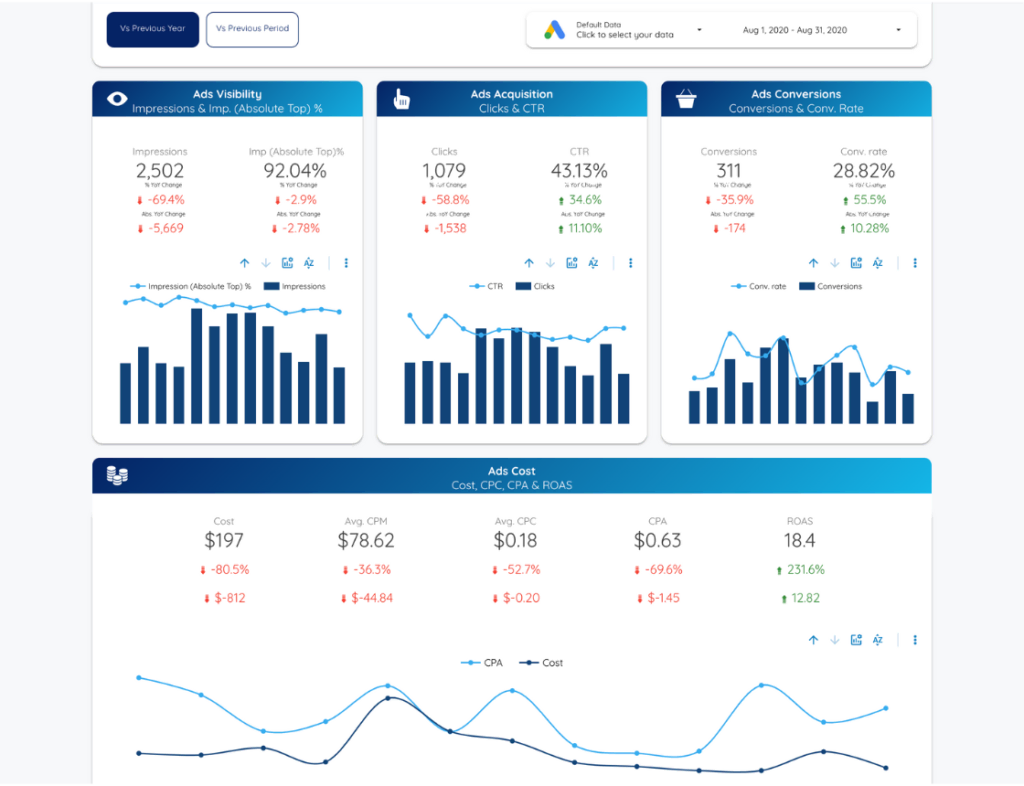
Relying on a single KPI can provide a skewed view of your campaign’s performance. Instead, use a balanced mix of volume, efficiency, and quality KPIs. This approach gives you a well-rounded understanding of your campaign’s effectiveness. For example you can pick the most important indicators from each of the following categories to review and optimize your SEM campaigns:
- Ads visibility
- Ads acquisition
- Ads conversion
- Ads cost
Regularly Review and Adjust Your KPIs
The performance marketing is constantly evolving with new ad formats and mediums, and so should your KPIs. Regularly review your chosen KPIs to ensure they still align with your business goals and campaign objectives. Don’t be afraid to adjust your focus as your campaigns and goals evolve.
The Top 14 Google Ads KPIs to Track
Click-Through Rate (CTR)
This metric is a critical indicator of how well your ad captures the attention of your target audience. It’s calculated by dividing the number of clicks your ad receives by the number of times it’s shown (impressions).
A high CTR suggests that your ad is relevant and engaging to viewers, while a low CTR may indicate that your ad is not resonating with your target demographic or that your ad placement is not optimal.
Use Case: Suppose you’re running a campaign for a seasonal sale. Observing an increase in CTR during the campaign period can indicate that your ad messaging is compelling and resonates well with your audience, prompting them to explore your offerings.

Cost Per Click (CPC):
CPC provides insight into the cost-effectiveness of your ad campaign. It’s determined by dividing the total cost of your clicks by the total number of clicks. This metric helps you understand how much you are paying on average for each click, which is essential for budgeting and bid strategy.
Monitoring CPC can help you adjust your bids to ensure you’re not overpaying for clicks and maximizing your budget.
Use Case: In a campaign aiming to drive traffic to a new lead generation landing page, analyzing and managing your CPC per ad group effectively allows you to maximize the number of visitors you attract and easily calculate the required budget to reach a certain amount of leads with a given budget.
Conversion Rate
The conversion rate is a key metric that measures the effectiveness of your ad in driving actions that are valuable to your business, such as sales, sign-ups, or leads. It’s calculated by dividing the number of conversions by the total number of clicks and multiplying the result by 100 to get a percentage.
This KPI helps you gauge how well your ad and landing page resonate with your audience and prompt them to take the desired action.
Use Case: For an online course registration, tracking how many ad clicks convert to course sign-ups can help you measure the effectiveness of your ad copy and the user experience of your landing page.
Quality Score
Quality Score is Google’s rating of the quality and relevance of your keywords and ads. It’s impacted by factors such as your ad’s click-through rate, the relevance of each keyword to its ad group, landing page quality, and the overall user experience.
A high Quality Score can lead to lower costs and better ad positions, making it a crucial metric to optimize for.
Use Case: When launching a new product, a high-quality score indicates your ads are well-tuned to your target audience, potentially lowering costs and improving visibility.

Impression Share
Impression share represents the percentage of impressions your ads received compared to the total number they were eligible to receive. It gives you an idea of how much market share your ads are capturing in the available inventory. This metrics allow you to measure the competition in given searches.
By monitoring impression share, you can identify opportunities to increase visibility and reach by adjusting your bids, budgets, and targeting.
Use Case: When pushing for top-of-mind brand awareness, maintaining a high impression share ensures your ads are consistently visible, reinforcing brand recall.
After an update on August 24, 2024, Google announced that it would no longer allow the export of auction insights from the Google Ads interface, which includes all the metrics and dimensions related to competition metrics such as impression share and auction insights domain. That means competition analysis (below) is not longer available in other tools like Looker Studio.

Cost Per Conversion/Acquisition (CPA)
CPA measures the cost of acquiring a conversion, offering a clear view of the efficiency and effectiveness of your ad in driving customer desired actions such as form submissions, checkouts and purchases.
This metric is particularly important for understanding how your advertising spend translates into tangible results for your business.
Use Case: For a campaign aimed at increasing subscriptions, analyzing the CPA helps in understanding whether the cost aligns with the lifetime value of a subscriber, guiding budget allocation decisions.
Return on Ad Spend (ROAS)
ROAS is a critical metric for evaluating the profitability of your ad campaign. It calculates the amount of revenue generated for every dollar spent on advertising. This metric is similar to advertising cost of sales.
A high ROAS indicates a successful campaign that contributes positively to your bottom line, while a low ROAS suggests the need for optimization and strategy adjustments.
Use Case: An e-commerce brand can use ROAS to determine which products or categories yield the highest return on advertising spend, allowing to better budget allocation.
Conversion Value / Cost
This metric helps you understand the value you’re getting from your conversions in relation to what you’re spending on ads.
It’s a crucial indicator of the financial effectiveness of your campaign, helping you evaluate whether your investment in advertising is yielding a sufficient return in terms of the value generated from conversions.
Use Case: By evaluating the conversion value against the cost for a promotional campaign, you can pull the direct return, which allows you to optimize your promotional strategies.
Click Conversion Rate
This KPI measures the percentage of ad clicks that result in a conversion, providing insight into how effectively your ad prompts users to complete a desired action.
It’s a more specific metric than the overall conversion rate as it ties the conversions directly to the clicks, offering a focused view of your ad’s performance.
Use Case: In a campaign aimed at online document downloads, this KPI helps evaluate how effectively the ad and the subsequent landing page convert interest into actual downloads.
Average Position
Although Google Ads has phased out the average position metric, understanding where your ads typically appear on the search results page can still provide valuable insights.
It can affect your ad’s visibility and the likelihood of clicks, influencing your campaign’s overall effectiveness.
Use Case: Knowing your ads’ average position in a highly competitive market helps you strategize bid adjustments or ad optimizations to improve visibility and performance.
Lost Impression Share (Budget)
This metric shows the percentage of times your ad wasn’t shown because your budget was insufficient.
It can highlight opportunities for improving campaign performance by increasing your budget, ensuring that your ads have the chance to compete more effectively in the ad auction.
Use Case: If your campaign for a flagship product loses significant impressions due to budget constraints, reallocating or increasing the budget can boost visibility and sales.
Lost Impression Share (Rank)
This indicates the percentage of impressions lost due to low ad rank, which can be influenced by your bids, ad quality, and the competitiveness of the auction.
Improving your ad rank can increase your ads’ visibility and the likelihood of receiving clicks.
Use Case: Identifying which campaigns lose impression share due to rank can prompt a review and adjustment of your ad relevance, bid strategies, or Quality Score optimizations.
Invalid Clicks
Monitoring invalid clicks is essential for maintaining the integrity of your campaign data and ensuring that your budget is spent on actual interactions.
Invalid clicks include fraudulent clicks, accidental double-clicks, and other non-genuine interactions that can inflate your costs and distort your campaign metrics.
Use Case: Regular analysis can highlight trends or irregularities, prompting further investigation or adjustments in targeting to mitigate any impact on your campaign performance.
Bounce Rate (for landing pages):
The bounce rate for your landing pages indicates the percentage of visitors who leave without taking any action.
Use Case: A high bounce rate can signal that your landing page is not meeting visitors’ expectations or that there is a disconnect between your ad and the landing page content, impacting the effectiveness of your campaign.
Integrating KPIs into Campaign Strategy
Once you’ve mastered the art of tracking and understanding the essential Google Ads KPIs, the next crucial step is to integrate these insights into your campaign strategy. This integration allows for data-driven decision-making, ensuring that your campaigns are optimized for the best possible outcomes.
Using KPIs for Better Decision-Making
Every KPI offers a piece of the puzzle in understanding your campaign’s performance. For instance, if your CTR is high but your conversion rate is low, it might indicate that while your ads are compelling enough to earn clicks, the landing page might not be effectively converting visitors. This insight directs you to focus on improving your landing page’s content, design, or call-to-action.
Adjusting Campaigns Based on KPIs
Regularly review your KPIs to identify trends and patterns. For example, if you notice a gradual increase in CPA, it could signal rising competition or changes in audience behavior. Responding to these changes promptly by adjusting your bid strategy or refining your target audience can help maintain or improve campaign efficiency. For this reason it is a good idea to set email send outs with your overall performance regularly.

A/B Testing Using KPIs
Leverage KPIs to conduct A/B testing on different elements of your campaigns. You can test various ad copies, landing pages, or targeting options and use KPIs to determine which variations deliver the best results. For instance, by experimenting with different call-to-actions and monitoring the impact on conversion rate, you can identify the most effective messaging for your audience.
Predicting Future Performance
Analyzing historical KPI data can help you predict future campaign performance and make more informed budgeting decisions. Understanding which campaigns or ad groups have historically provided the best ROAS can guide you in allocating your budget more effectively. That’s why you should always check the performance over time (per month, per week).
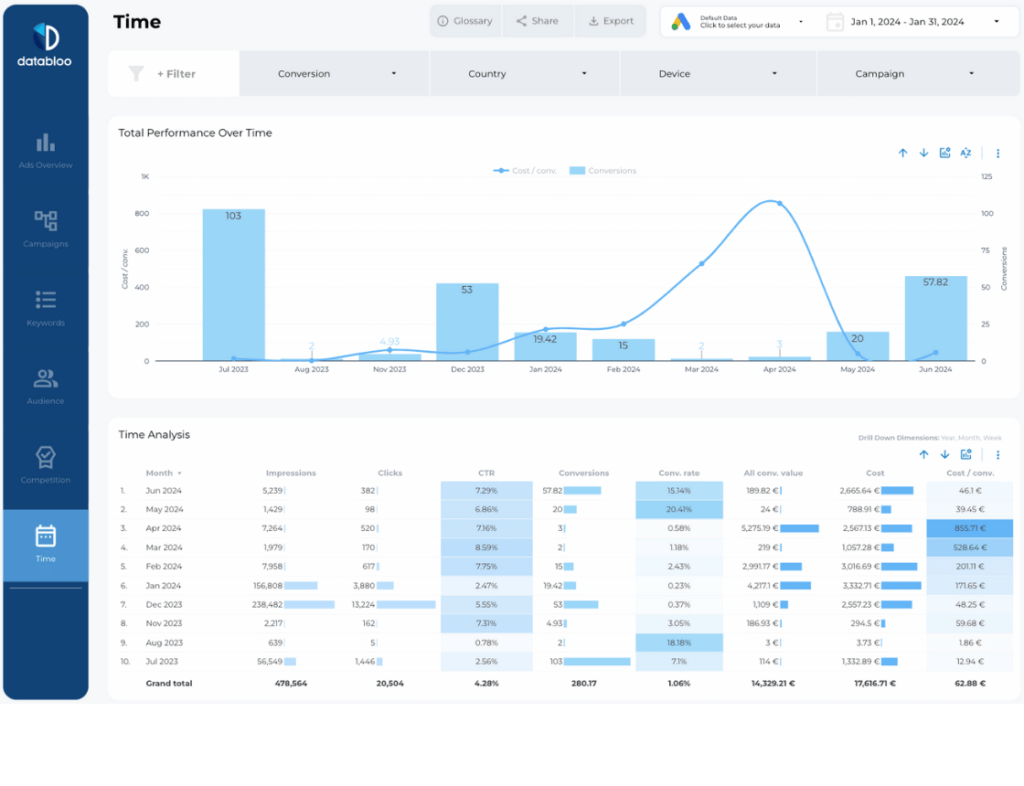
Continuous Monitoring and Optimization
Continuous monitoring of your KPIs is essential to stay ahead of your competition, get up to date with consumer behavior and platform algorithms. Regularly adjusting your strategies based on KPI trends helps maintain campaign relevance and effectiveness.
Monitor your Google Ads KPIs with Data Bloo Templates
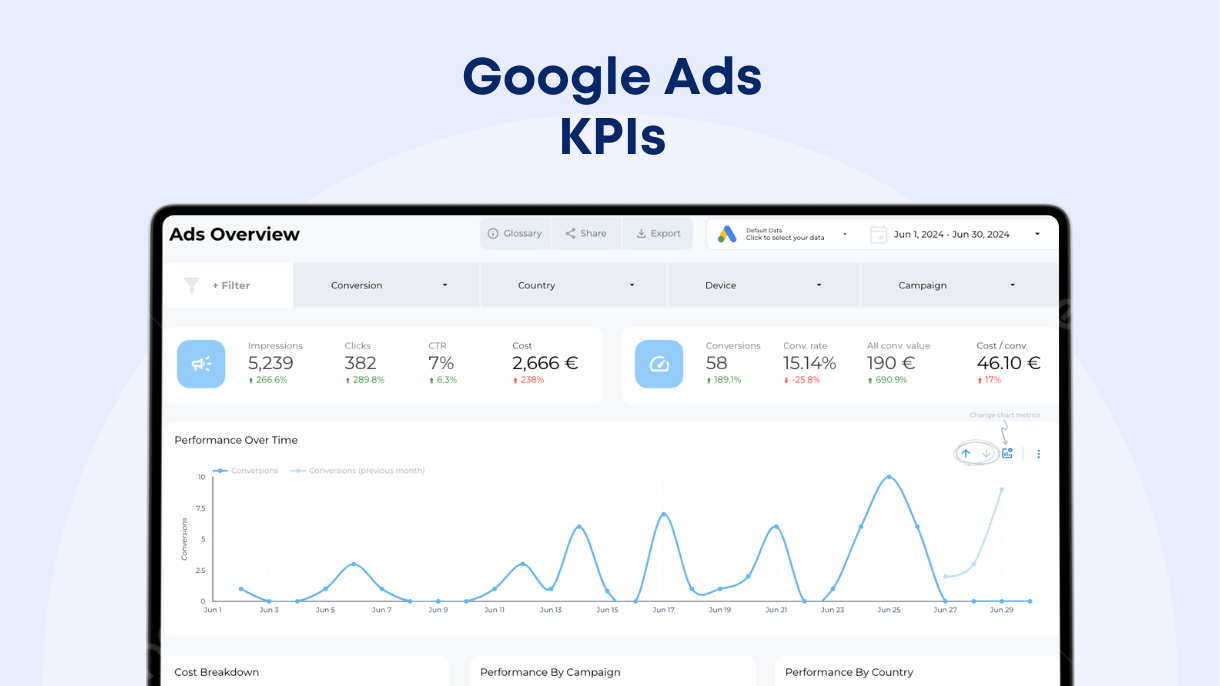
You can speed up your Google Ads reporting, using our ready-to-use Looker Studio Template that will allow you to monitor your KPIs in one place. On top of that you will be able to generate your own versions within minutes using our one click setup process, avoiding any manual configuration. Below you will find our Google Ads Looker Studio Templates.
Frequently asked questions
The most crucial KPIs in Google Ads include Click-Through Rate (CTR), Cost Per Click (CPC), Conversion Rate, Quality Score, and Return on Ad Spend (ROAS). However, the importance of each KPI can vary depending on your specific campaign goals, whether it’s brand awareness, lead generation, or sales.
It’s recommended to review your KPIs regularly to ensure your campaigns are performing optimally. For active campaigns, a weekly review can help you make timely adjustments, while a monthly review can provide insights for strategic planning and budget allocation.
Yes, a good Quality Score can significantly reduce your advertising costs. Google rewards ads with high Quality Scores by lowering their cost per click (CPC) and improving their ad placement. A high Quality Score indicates that your ad is relevant to users, providing a better experience for them and resulting in cost benefits for you.
If your campaign has a high CTR but a low conversion rate, it indicates that while your ads are effective in attracting clicks, they’re not leading to the desired actions on your website. This situation calls for a review of your landing pages. Ensure they’re relevant, persuasive, and aligned with the promises made in your ads. Additionally, consider testing different landing page designs, calls to action, and offers to improve your conversion rate.

