Table of Contents
Advertising report is a document, dashboard, or presentation that provides a comprehensive data into the performance of your advertising campaigns over a specific period of time and provides insights into key advertising metrics.
Advertising report is typically shared with or used by marketing departments and stakeholders to analyze and improve performance of advertising campaigns or shared with clients during agency and consulting reporting.
What Questions Should Advertising Report Answer?
Here are a few questions that every self-sufficient advertising report should answer:
- How many people engaged with the ad (clicks, likes, shares, comments)?
- What was the click-through rate (CTR)?
- What is the overall return on investment (ROI) for each ad campaign?
- How does the cost per acquisition (CPA) fluctuate across different platforms, and where is ad spend most efficient?
- What patterns emerge in impressions and clicks, and how do they correlate with conversions?
- How do key conversion metrics vary by region, and which markets demonstrate the highest return potential?
- Which demographic segments engage most effectively with your ads, and how do their behaviors differ?
- Are engagement rates trending upward, and how does month-over-month performance compare?
- What is the click-through rate (CTR), and how does it align with industry benchmarks?
- What is the total ad spend over the selected period, and how does it break down by campaign and channel?
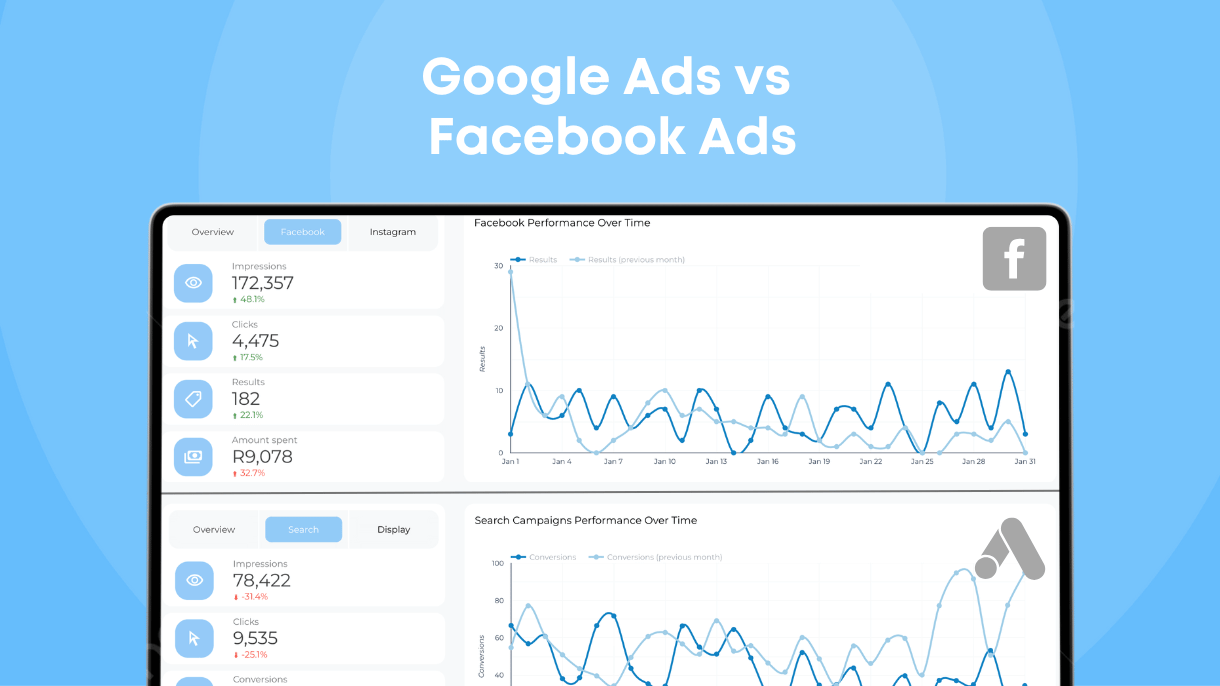
Of course, there should also be specific questions for each platform that you advertise on, such as Facebook Ads, Google Ads, Youtube and so on.
You need to take into account the metrics that each advertising platform supports and try to find new insights that can be obtained by tracking these metrics.
What Sections Should Advertising Report Include
The composition of a typical advertising report should depend on what platform you’re advertising on, who will be reviewing and using this report, the frequency of reporting (daily and quarterly advertising reports will be focusing on different metrics).
Below are the sections that should form the backbone of any advertising report.
Overview Section
Most advertising reports typically start with an overview section that helps gain understanding of your advertising performance without overwhelming readers with too many details.
Usually it displays primary advertising KPIs (key performance indicators) such as number of clicks, conversions, ad spend, and top performing campaigns.
A well-composed overview section will help you start reporting meetings or understand what metrics and segments of advertising data to focus on later.
In some cases, especially when sharing the report with external stakeholders, the overview section may include a brief summary or executive summary explaining the purpose of the report and what each section covers.
Campaigns Performance
Campaign section of advertising reports focuses on advertising campaigns performance.
Typically this section contains campaign performance data in a visual way (graphs, pie charts) to help you discern top performing advertising campaigns from campaigns that should be improved.
Key metrics in this section often include:
- Impressions. How many times the ads were displayed.
- Clicks & Click-Through Rate (CTR). How often users clicked on the ads.
- Conversions & Conversion Rate. The percentage of users who took a desired action.
- Return on Ad Spend (ROAS). Profitability of each campaign.
Campaign performance data can be combined with audience behavior metrics to understand which segments drive the best results. However, audience insights are typically presented in a separate section for more in-depth analysis.
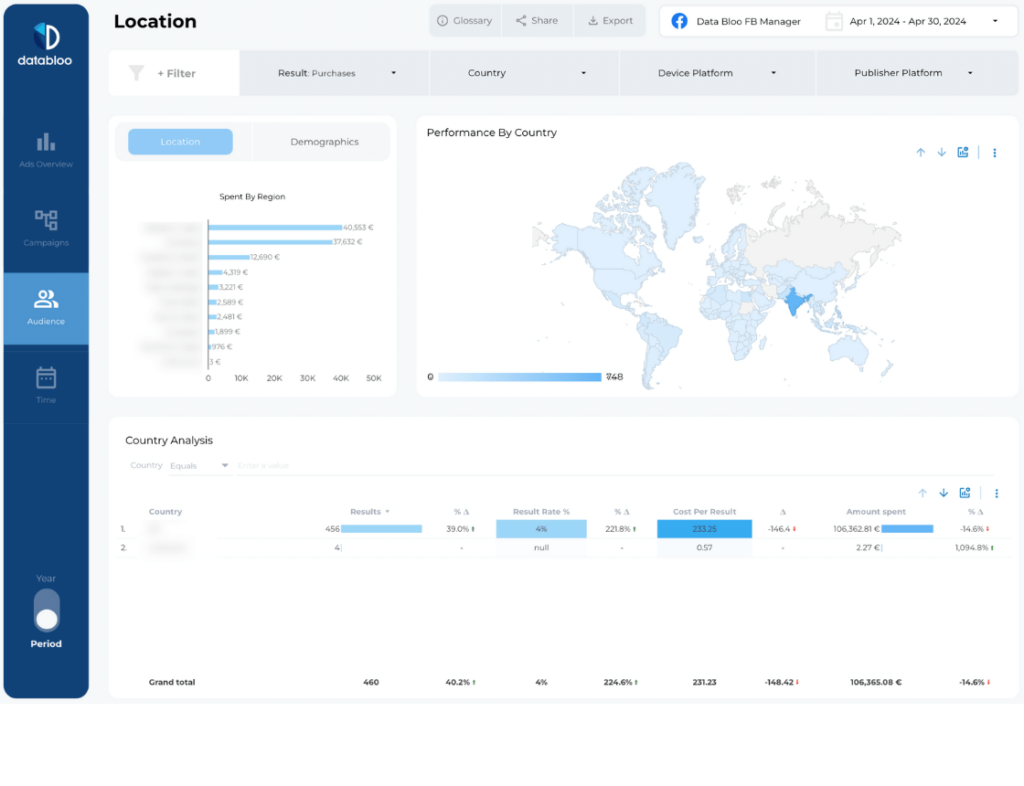
Audience Insights
The Audience Insights section helps advertisers understand how different audience segments interact with their ads.
This section typically includes data on:
- Demographics. Age, gender, less often income level, etc.
- Location. Which regions or countries respond best to the ads.
- Device Usage. Mobile vs. desktop performance comparison.
- Engagement Trends. How different groups interact with ads over time.
Time Period
Measuring performance over specific time periods allows advertisers to track trends, compare results, and make data-driven adjustments.
This section typically includes:
- Daily, weekly, monthly, or quarterly performance breakdowns.
- Comparisons to previous periods (e.g., Month-over-Month or Year-over-Year trends).
- Seasonal trends and anomalies that impact ad performance.
By focusing on both short-term and long-term metrics, advertisers can optimize their budget allocation, bidding strategies, and ad placements for better results.
Try These 4 Advertising Reports
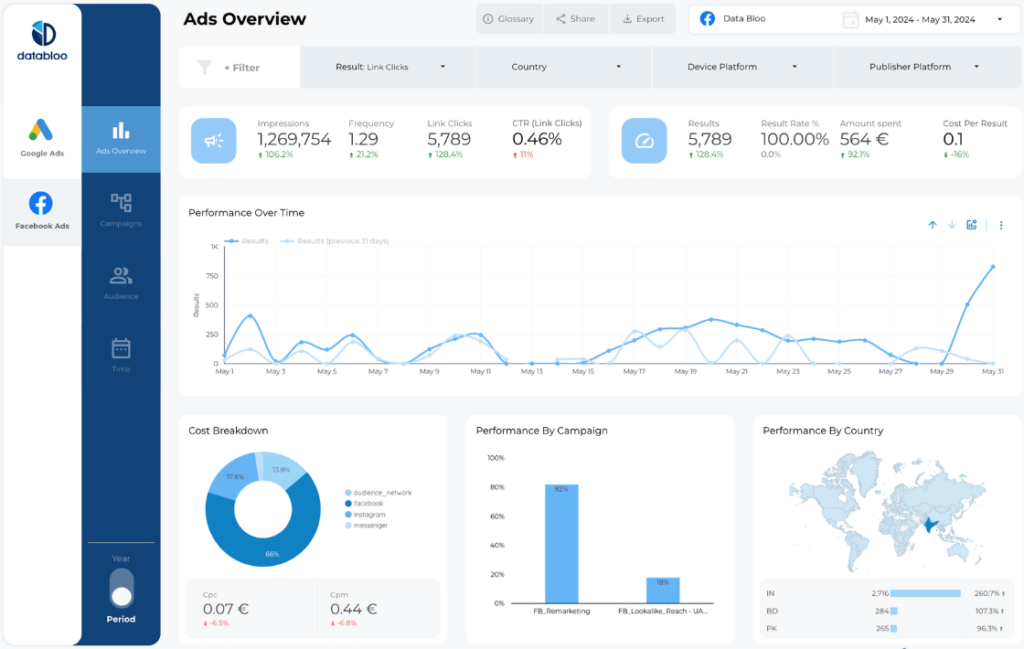
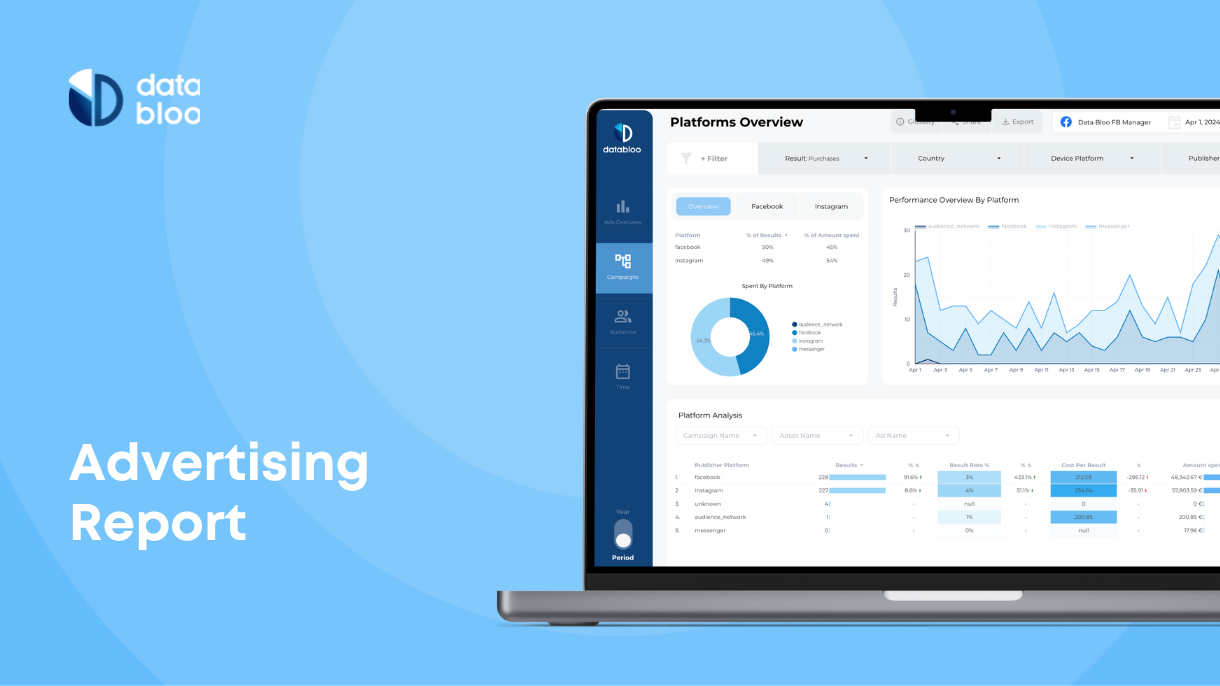
Facebook Ads Looker Studio Report
Advertising on Facebook can be a game-changer for your business, but managing the data from your ads can feel overwhelming. Our Facebook Ads Report Template is a powerful tool designed to simplify this process, turning complex ad data into clear, actionable insights.
With this report, you can easily track your campaign performance, make informed budget decisions, and optimize your results with confidence.
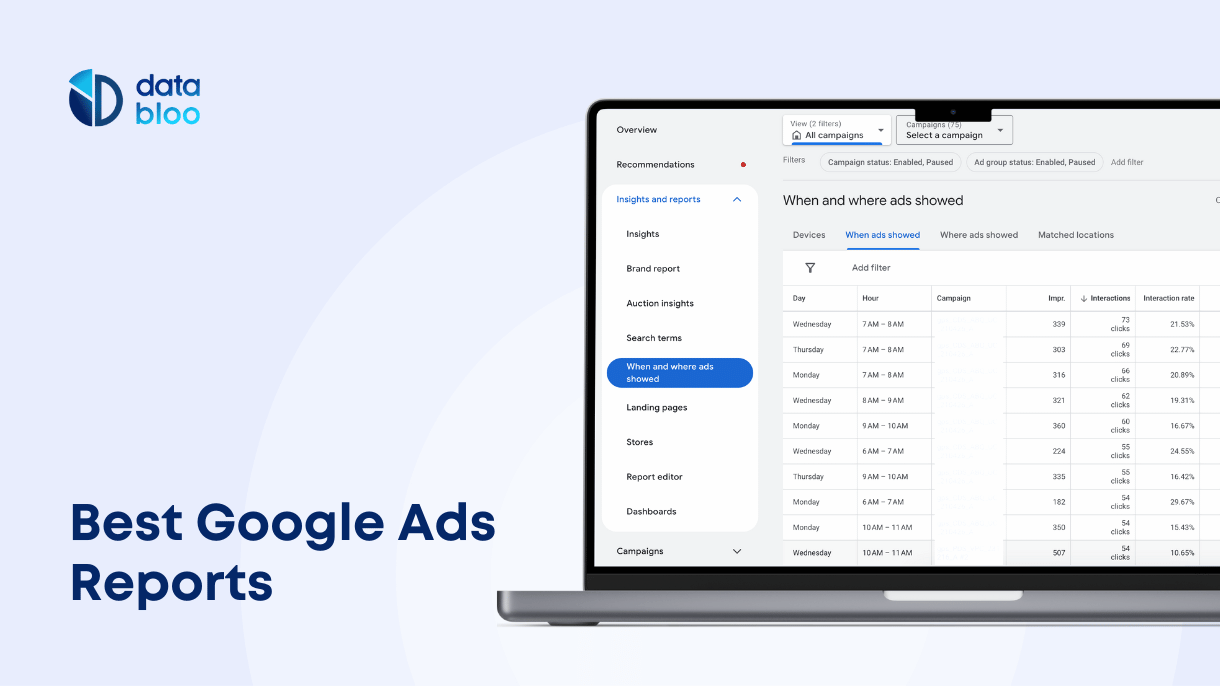
Essential Google Ads Looker Studio Template
The Essential Google Ads Report gathers all crucial ad data in one convenient place, making it easier to track your campaign performance.
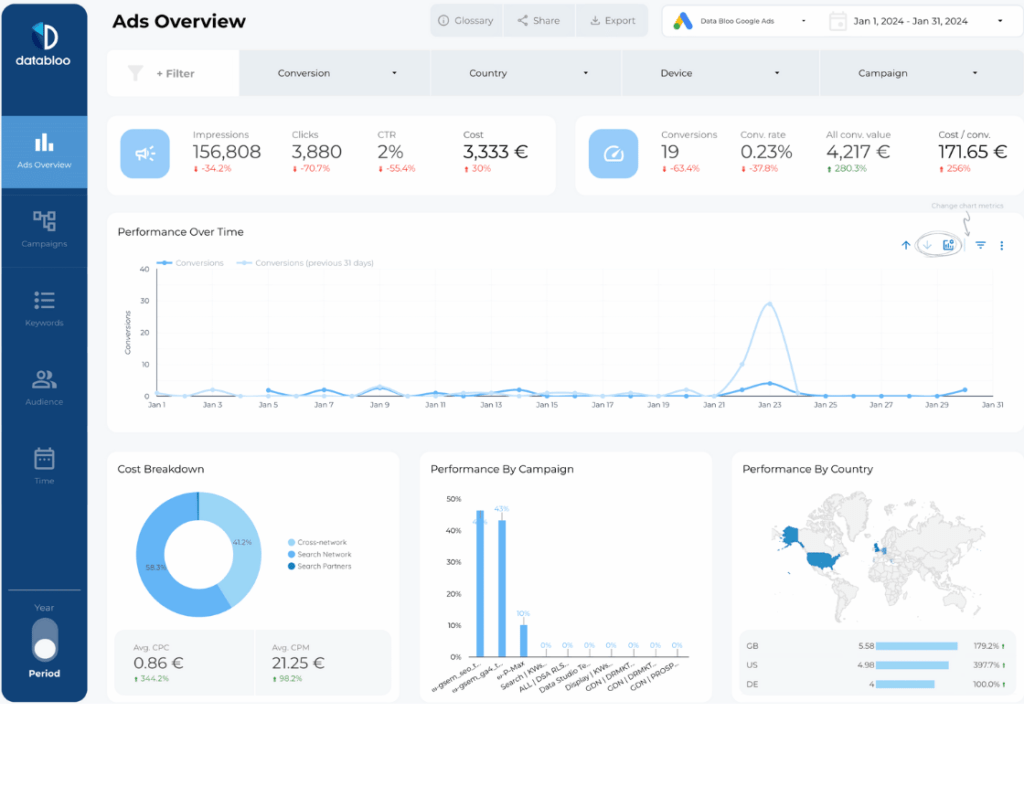
It features multiple insightful modules, each designed to deliver a unique perspective on your Google Ads metrics, helping you make data-driven decisions with ease: Ads Overview, Keywords, Campaigns, and Audience.
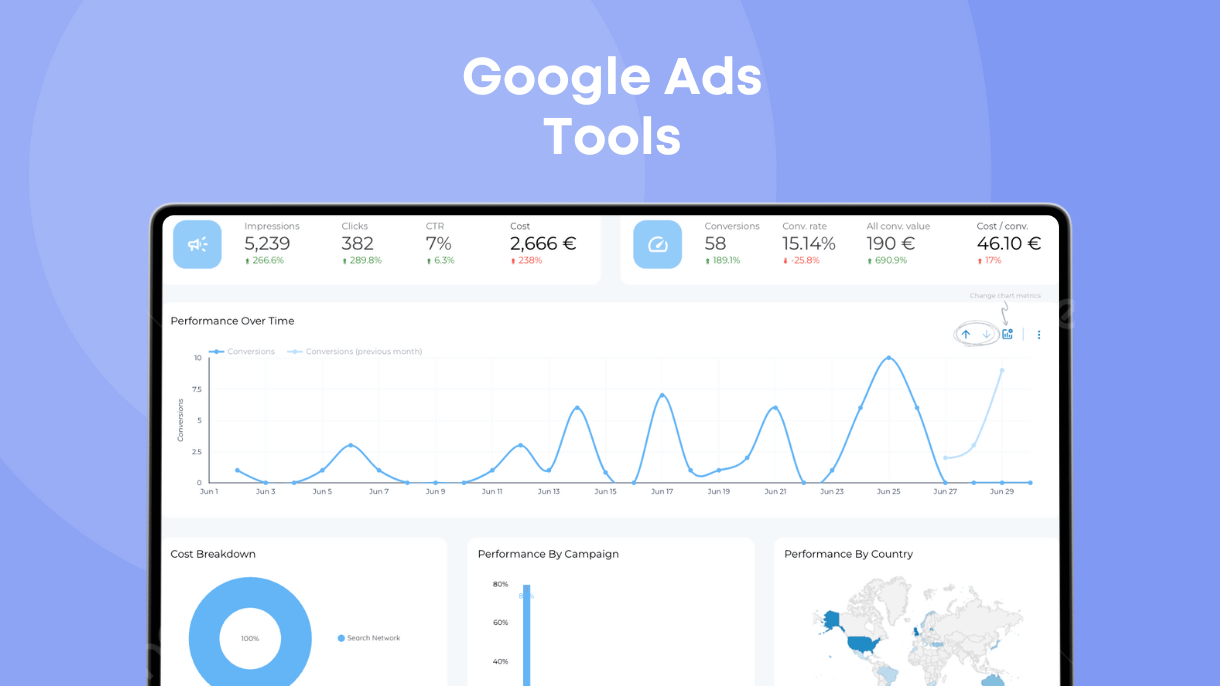
Google Ads Single Page Report Template
Databloo’s single-page Google Ads report offers a streamlined condensed version of key ad performance metrics, providing a clear and intuitive interface for tracking your primary KPIs.
This report is ideal for overviews and weekly reporting, and keeps you informed without overwhelming you with excessive details.
It easily connects to your Google Ads account and updates in real-time, ensuring you always have the latest insights at your fingertips.
Custom Ads Reporting Template
If you want to create a custom advertising report with several data sources, and customize fully the layout, deciding on what KPIs to track, Databloo offers a custom reporting solution that works like a lego constructor.
With our user-friendly interface, you can build customized advertising reports tailored to your company or clients’ needs within minutes. The report will be updated automatically every time you access it, and you can easily keep adjusting it based on your reporting needs.