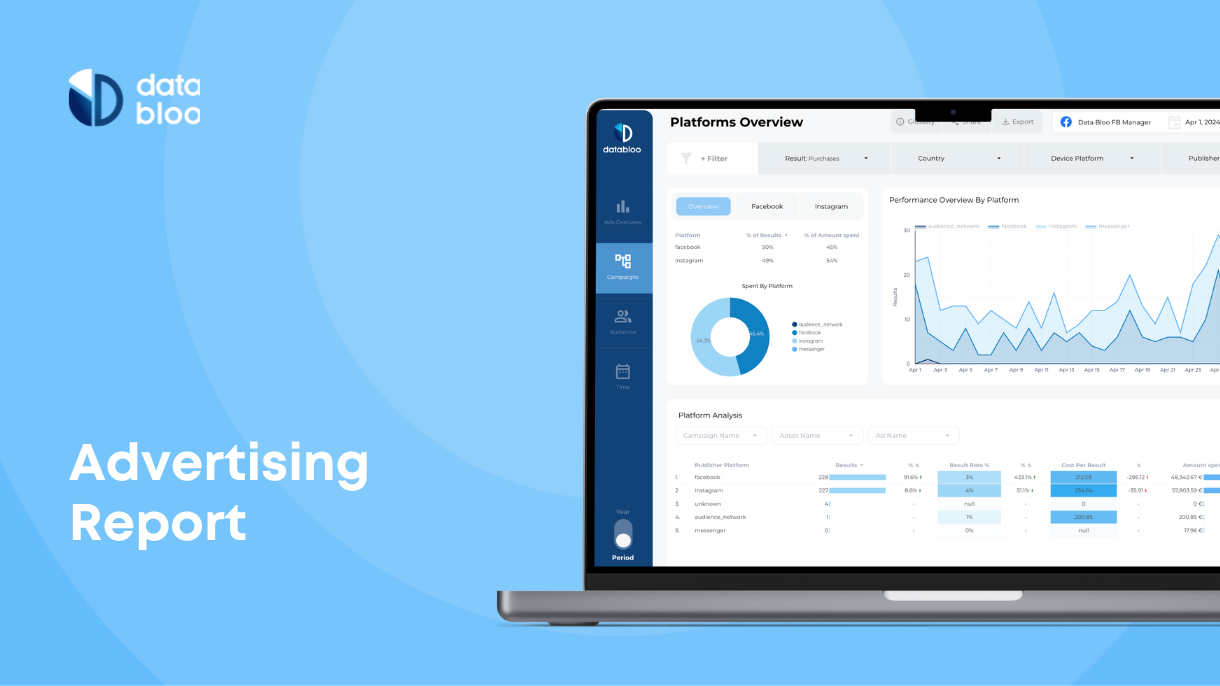
Want to tell great stories about the performance of your Ecommerce? You can use these Data Studio templates in order to automate your reporting process and get actionable insights about your overall digital activity.
1) Google Analytics Audit
Data Source: Google Analytics, Google Ads
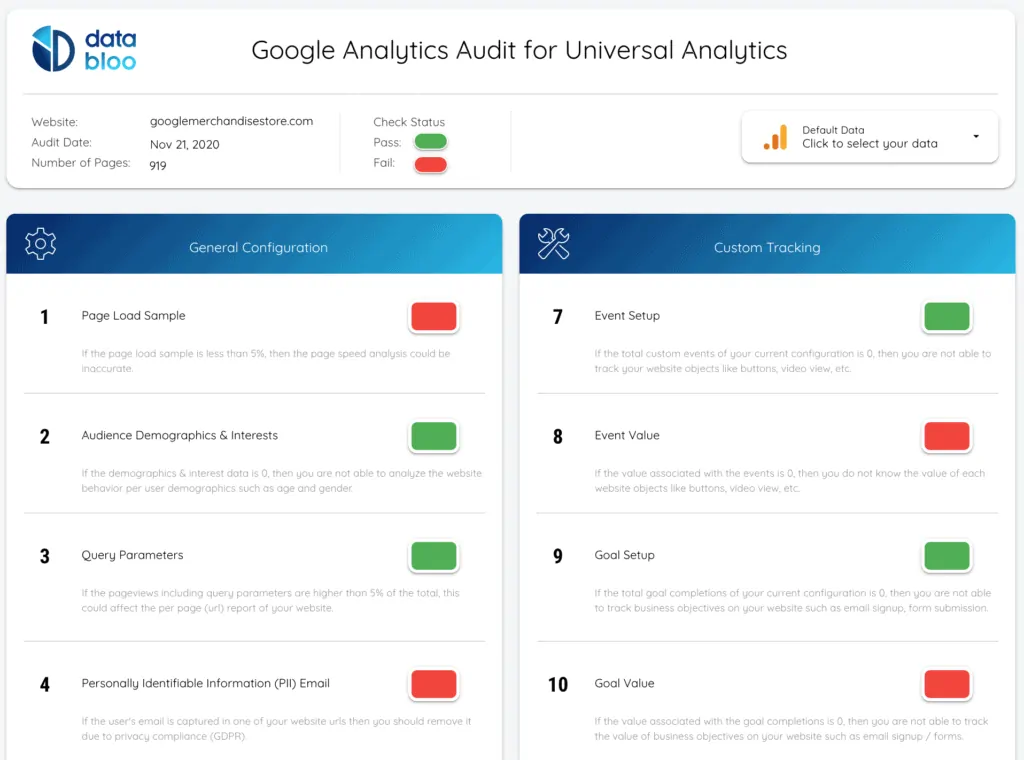
As a starting point and before analyzing your numbers on dashboards, it would be good to check if you can rely on the quality and accuracy of your data. You can use this Google Analytics Audit in order to easily understand what is missing from your current configuration. This health check gives you a clear picture of your current implementation.
2) Ecommerce Revenue Template
Data Source: Google Analytics
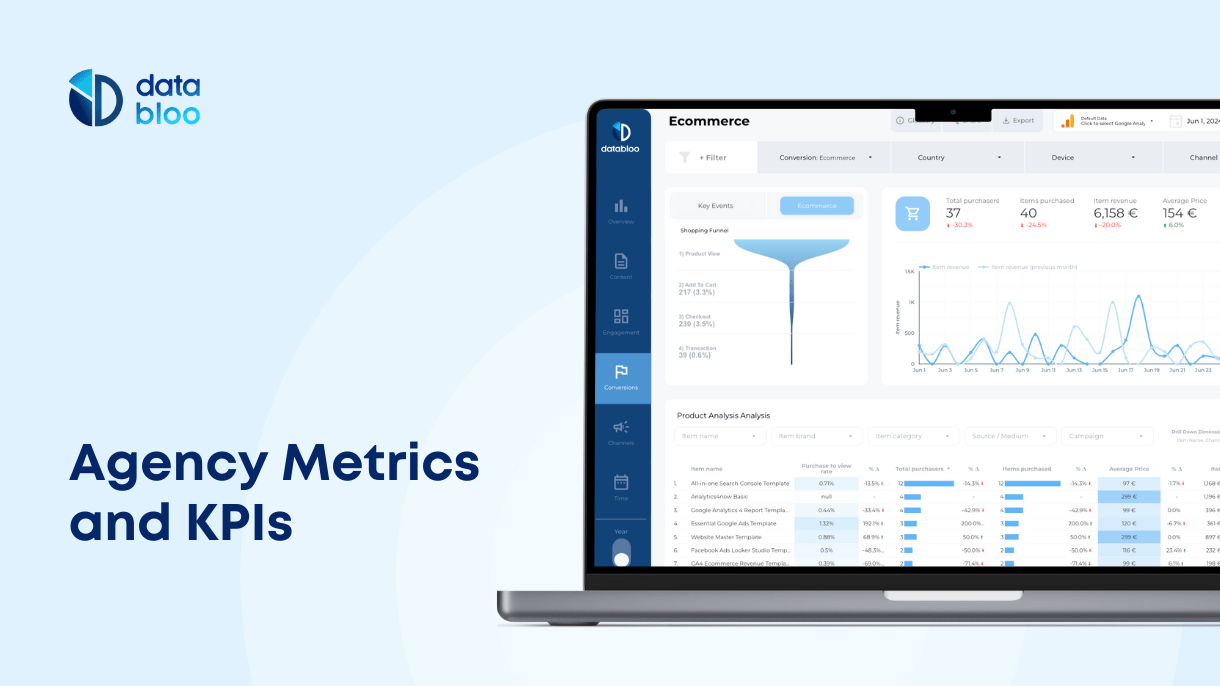
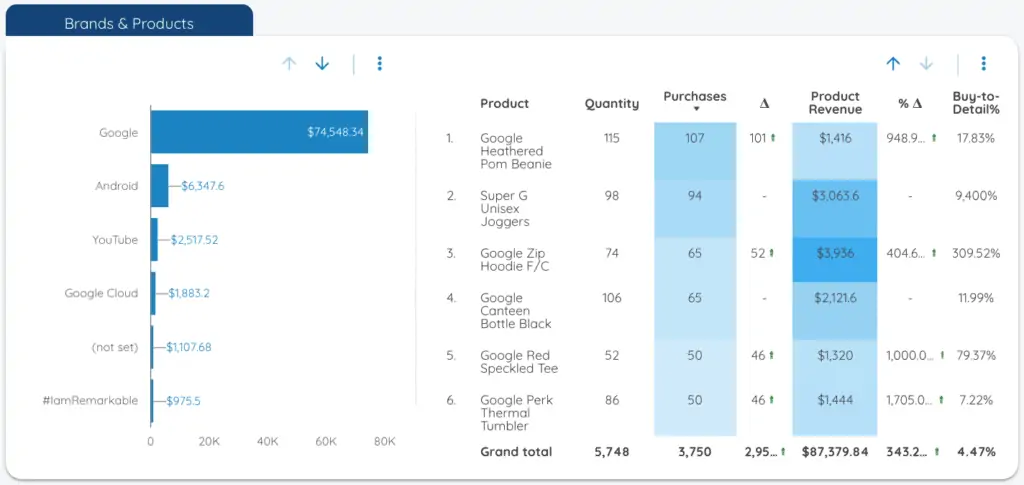
This template can help you monitor the revenue of your Ecommerce in one place and compare it to the previous period. You can easily view the sales trend over time, the best selling products and brands, the shopping funnel drop outs / conversions and the revenue breakdown by channels and devices.
3) Sales & Shopping Behavior Dashboard
Data Source: Google Analytics
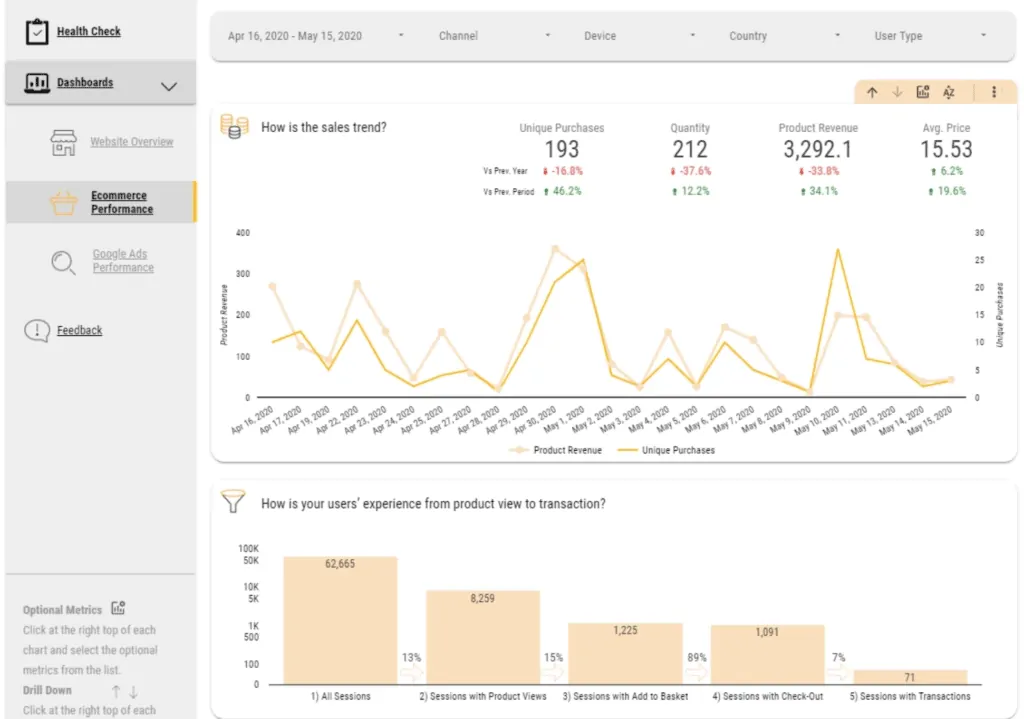
You can pull detailed insights for sales trend and users’ experience from product view to the transaction, combining multiple filters (channel, device, geography, and user type). In addition it reports the most popular brands and best-selling products.
4) Ultimate Google Ads Dashboard
Original Post | Data Source: Google Ads
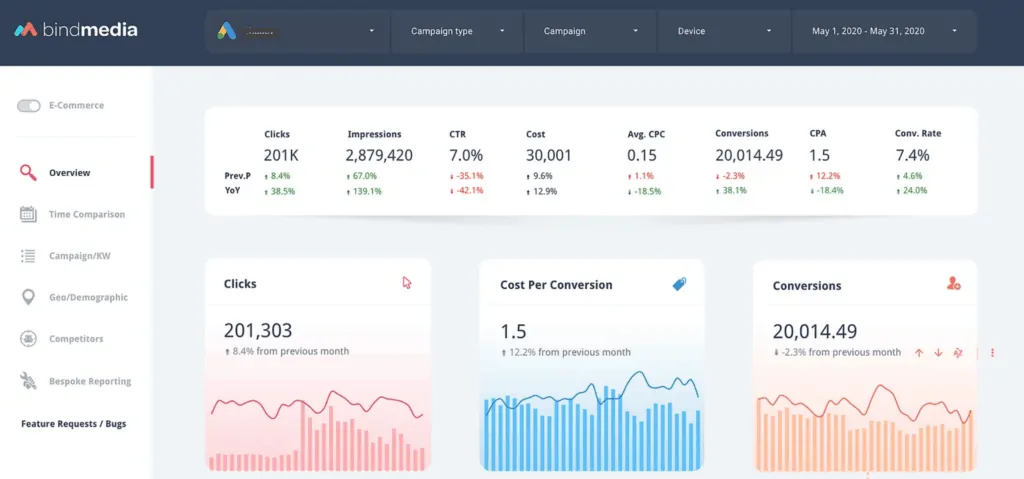
This Google Ads Template with a very beautiful and sophisticated menu helps you to drill down from your ads performance (campaigns, ad group & keyword) to quality score reporting and competitor insights. Moreover, it allows you to select between Ecommerce and Lead Generation analysis.
5) Search Console Explorer Studio
Original Post | Data Source: Google Search Console
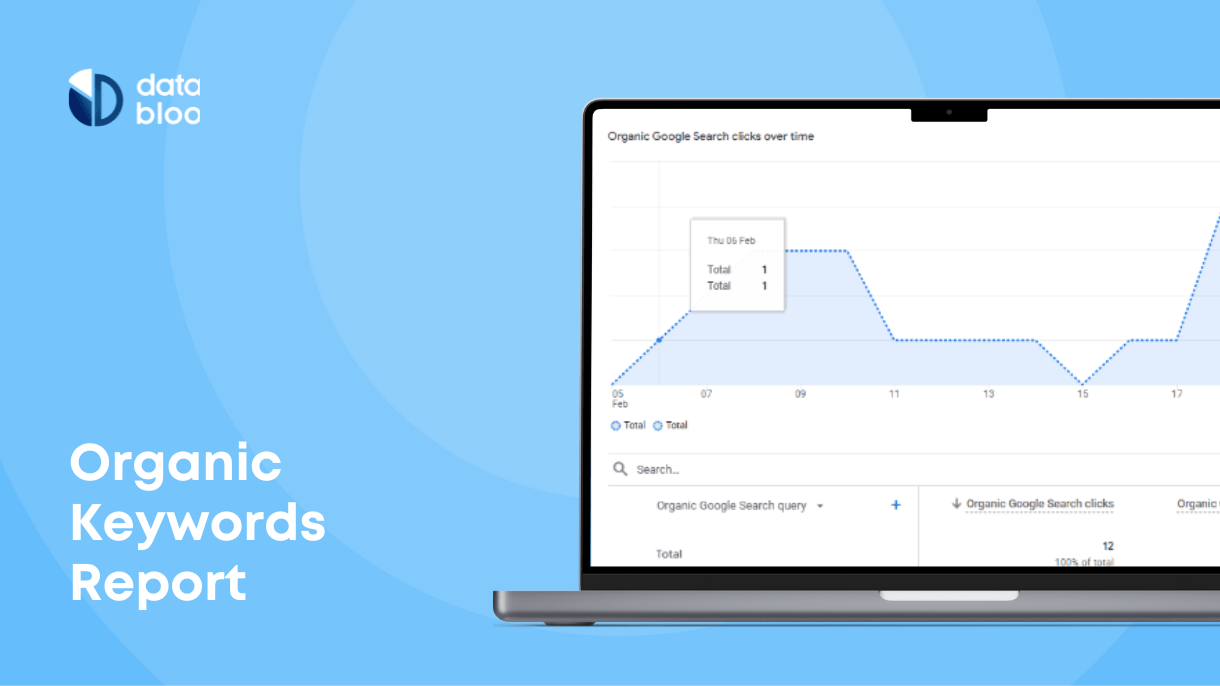
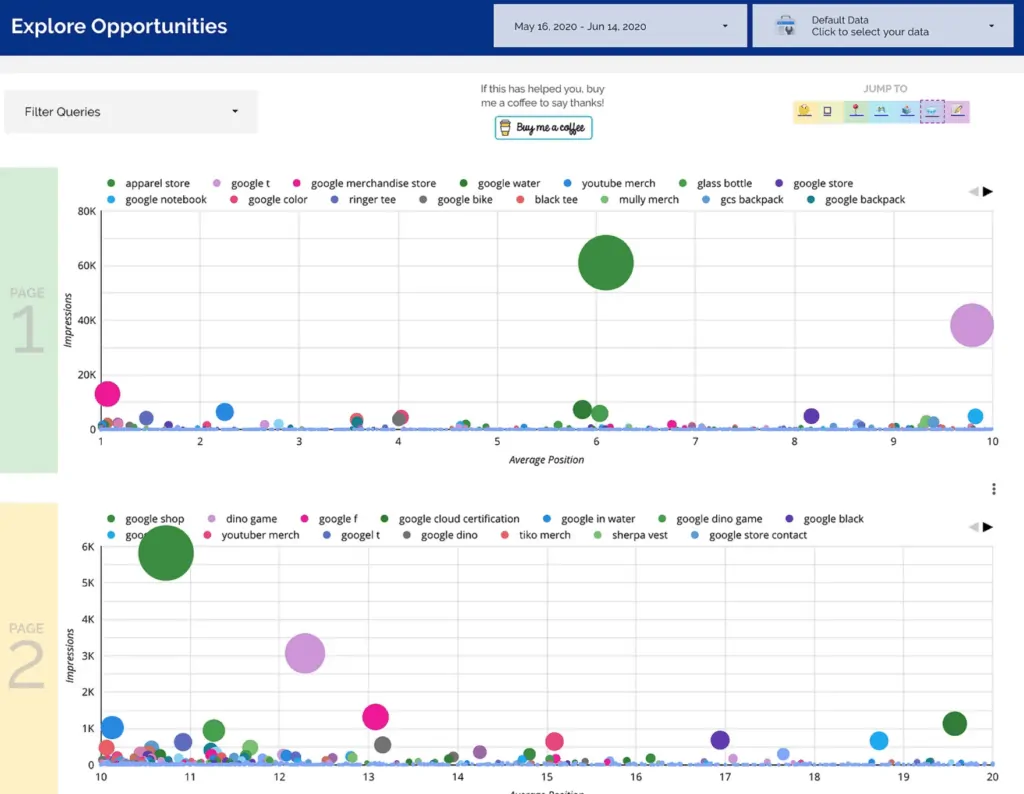
A 7-slide Dashboard that includes almost everything about your Google Search Console data in all available dimensions such as search queries, locations, devices. The “jump to” menu allows you to navigate more easily your data.
6) All-in-one Search Console Template
Data Source: Search Console
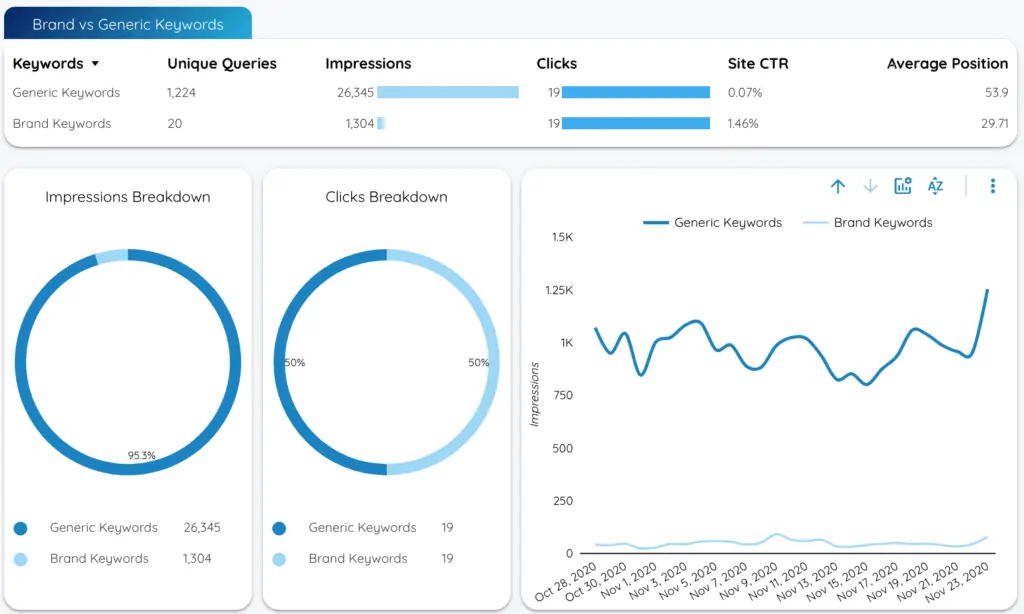
By using this template you can track the Organic Search KPIs over time along with the volume of indexed pages and queries on Google. Moreover, you can easily analyze the performance of your organic queries in terms of your brand (Brand Vs Generic), length (Short-tail Vs Long-Tail), and page position.
7) KPI Summary Dashboard
Original Post | Data Source: Google Analytics, Google Ads, Search Console
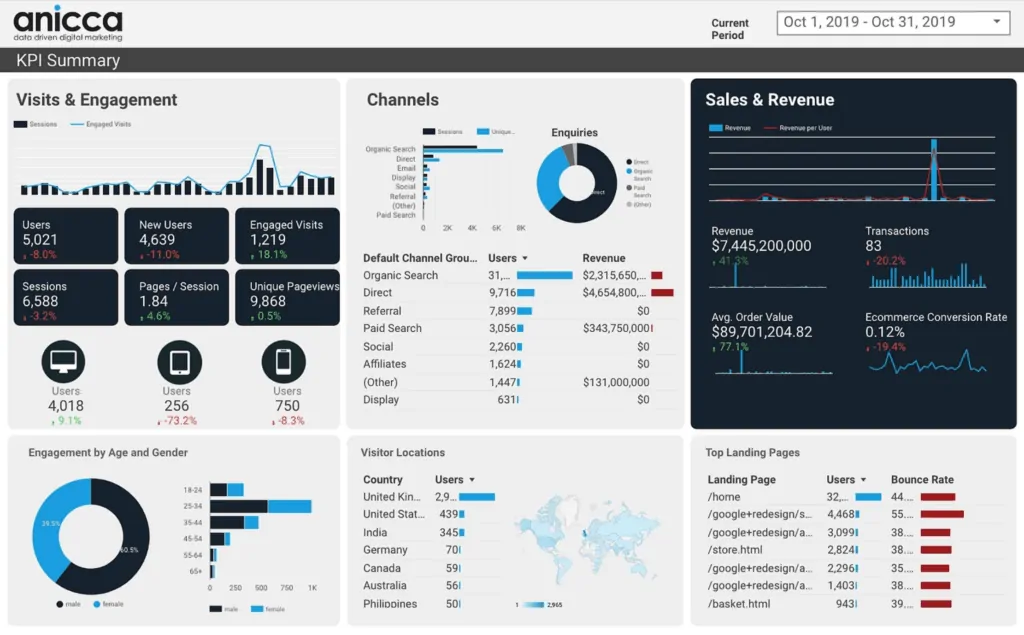
You can gain a holistic view of your business, from the digital overview & main sales KPIs to content analysis. It is a very nice dashboard that includes 10 different slides, emphasizing on the performance of your default marketing channels (organic, paid, social, referral).
8) Enhanced E-Commerce Funnel Template
Original Post | Data Source: Google Analytics
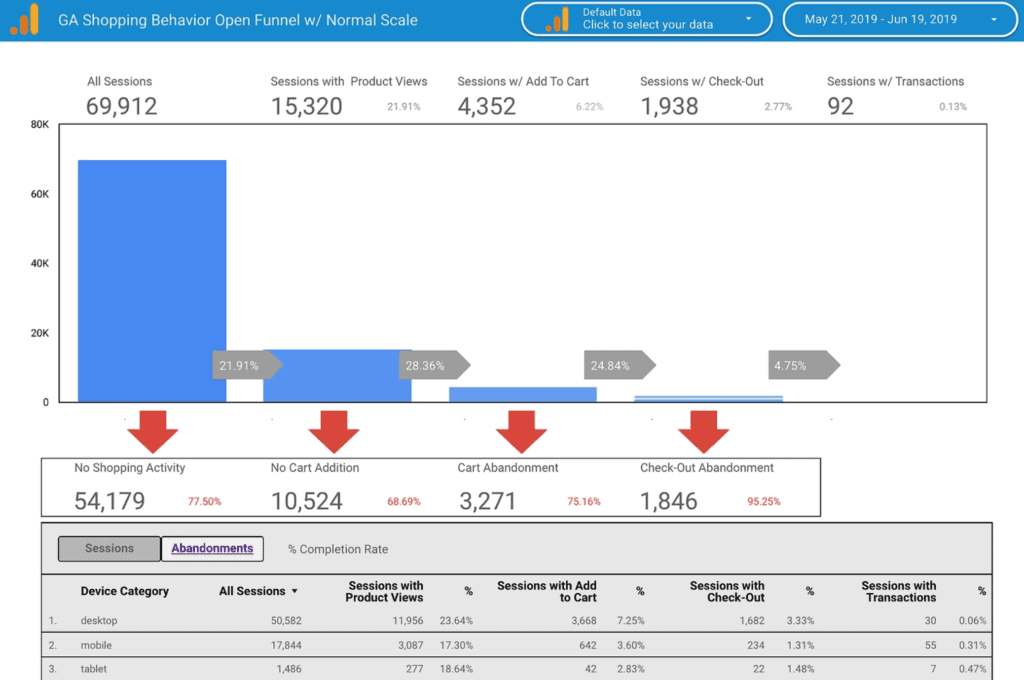
This template shows the Shopping Behavior Funnel as appears in the ecommerce section of Google Analytics. By using it you can find the abandonment and continue rates per step of the booking funnel and identify customer behaviors in the buying process.
9) User Experience Dashboard
Original Post | Data Source: Google Analytics
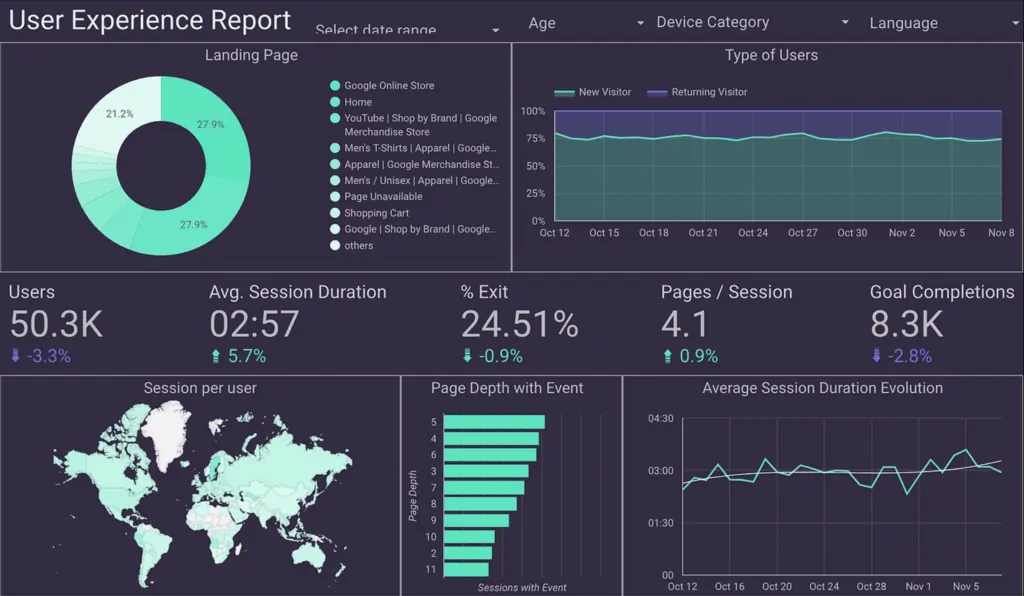
This dashboard presents some behavior metrics and helps you to discover and analyze user pain points when it comes to UX. By drilling down you can identify actions that might solve user experience issues.
10) Site Speed Performance
Data Source: Google Analytics
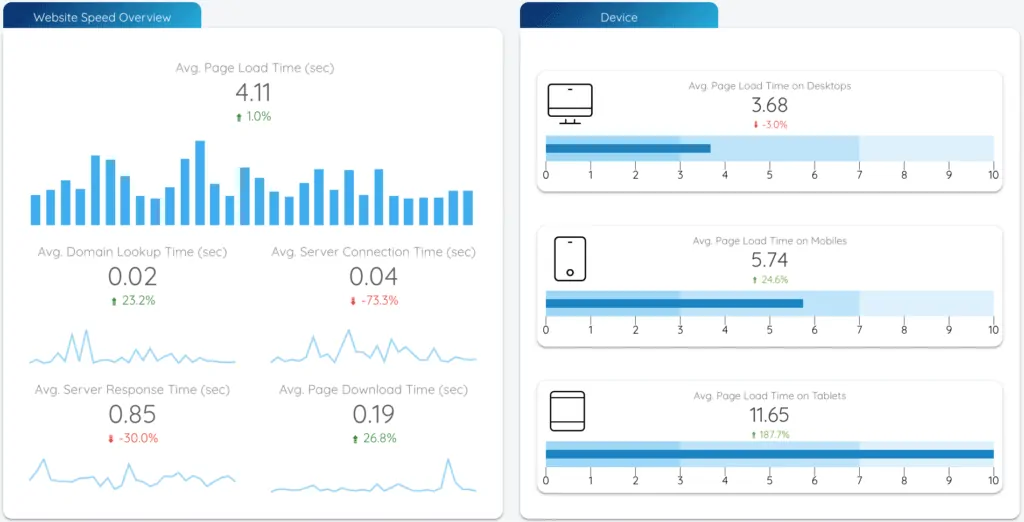
You can get useful insights about your website speed performance combined with different dimensions such as device, operating system, browser, date & time, location, and visit type. Also, it displays your high (less than 3 sec) and low (more than 7 sec) performing pages in terms of page load time.
11) The Next Ad’s Facebook Campaign Dashboard
Data Source: Facebook Ads (via Supermetrics)
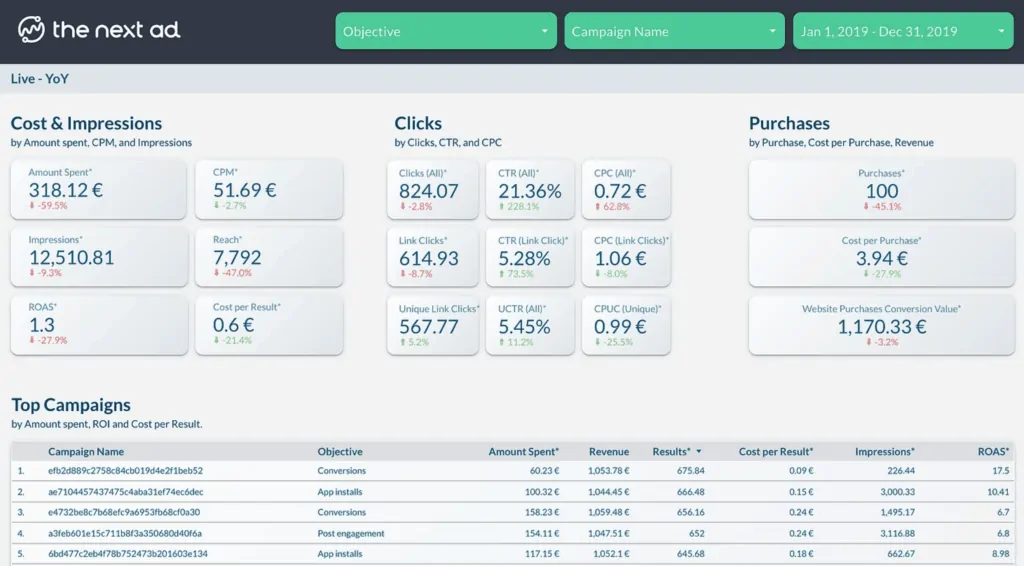
You can use this dashboard in order to track the data of your Facebook Campaigns in one place. It shows the ad activity based on your objectives and campaign names.
12) Aro’s Data Studio Dashboard
Original Post | Data Source: Google Analytics, Google Ads, Facebook, Search Console
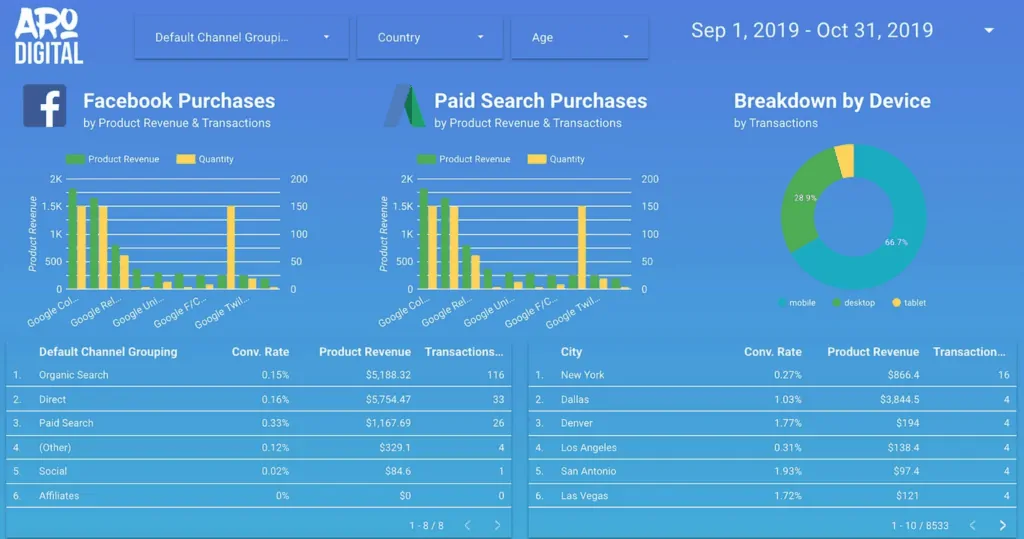
This dashboard allows you to analyze 4 different data sources. You can pull useful insights from your paid ad activity by segmenting your data per channel, location, and age group.
13) Google Search Console Performance Dashboard
Original Post | Data Source: Search Console
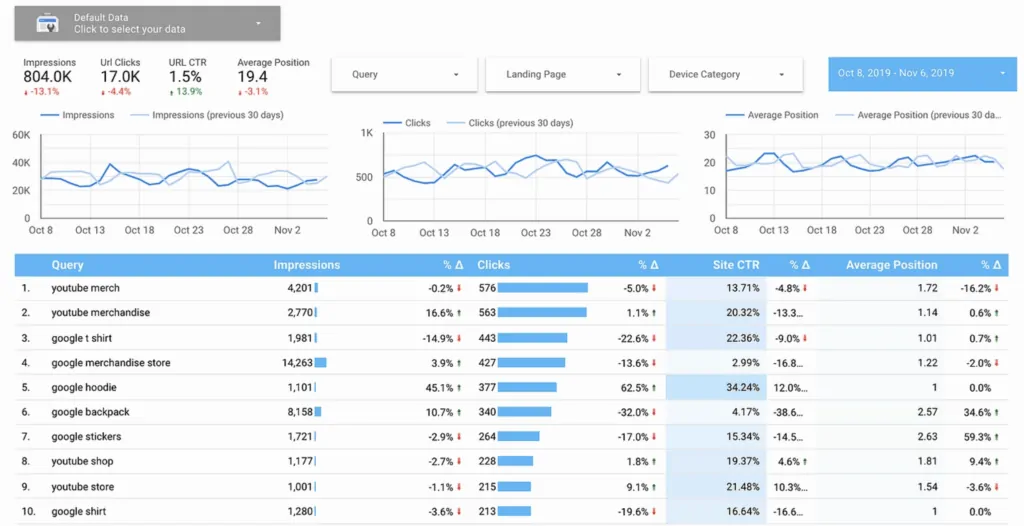
You can analyze post click data on search results and find user patterns on Google. This dashboard points out the issues that you might have with your most important queries over time. It also reports what landing pages (along with specific keywords) drive the majority of your organic traffic.
Tip: If you want to drill down your queries by brand / non brand, you can check this post.
14) Multichannel Attribution Dashboard
Original Post | Data Source: Google Ads, Facebook Ads, LinkedIn Ads, Bing Ads, Google Analytics
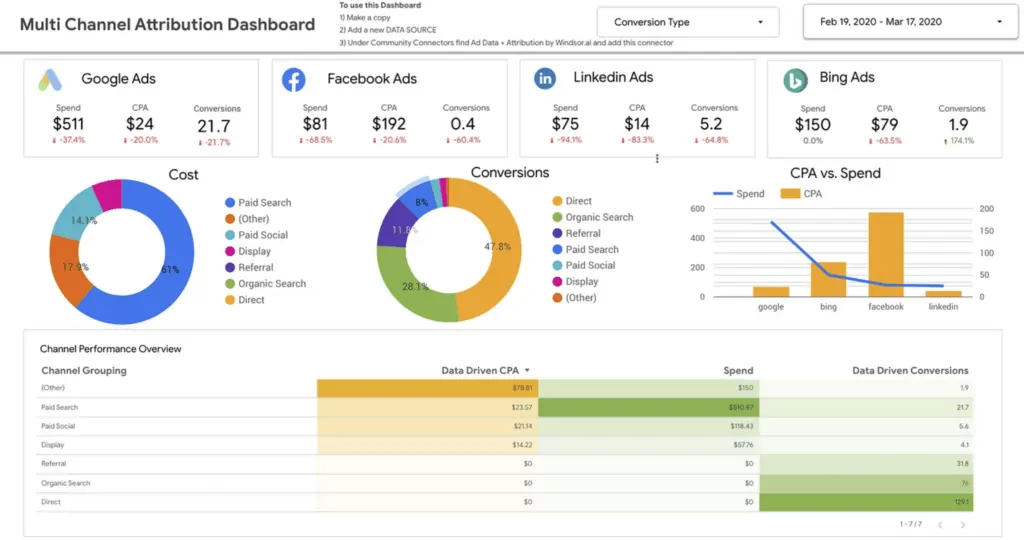
A single page dashboard showing the paid and non-paid media performance. It provides top-level data such as spend and CPA of your channels, so you can better understand their contribution to your marketing goals.
