Table of Contents
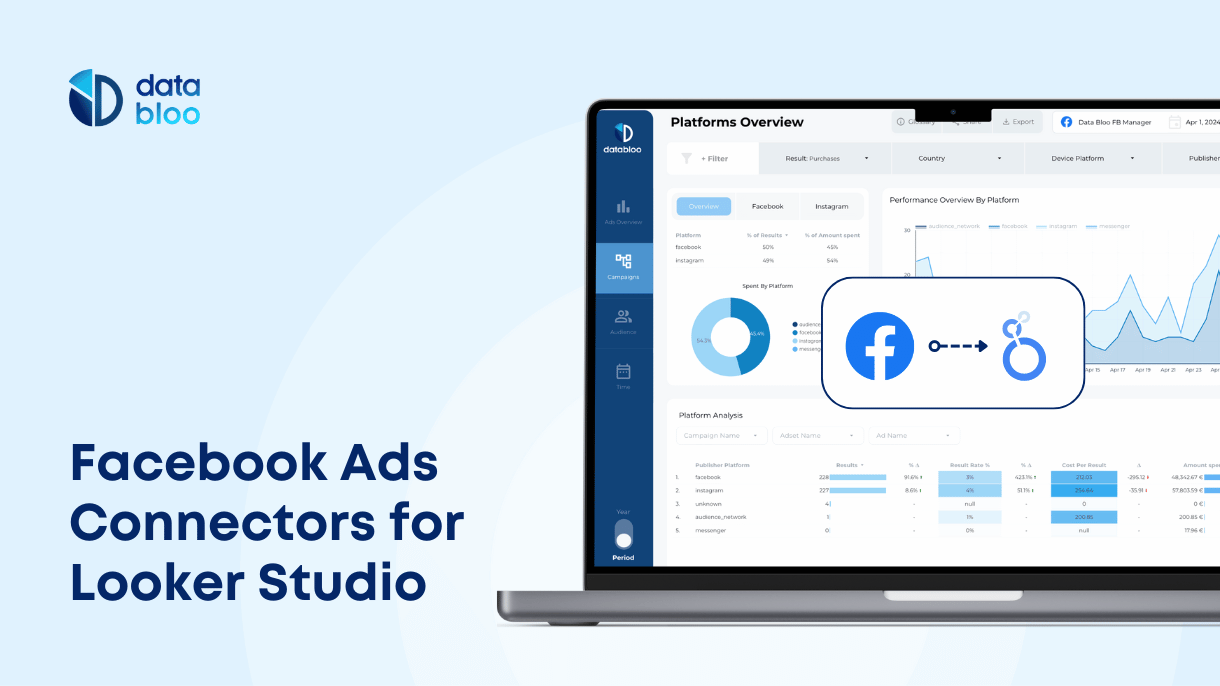
This post showcases 2 free Facebook connectors for Looker Studio (formerly Data Studio), so you can easily gather all the Facebook ads data on a dashboard without paying any subscription.
Facebook campaign data is crucial for any media buying decision. As marketers, we invest time and resources in order to gather all the important info in one place and closely monitor the overall performance of our ads.
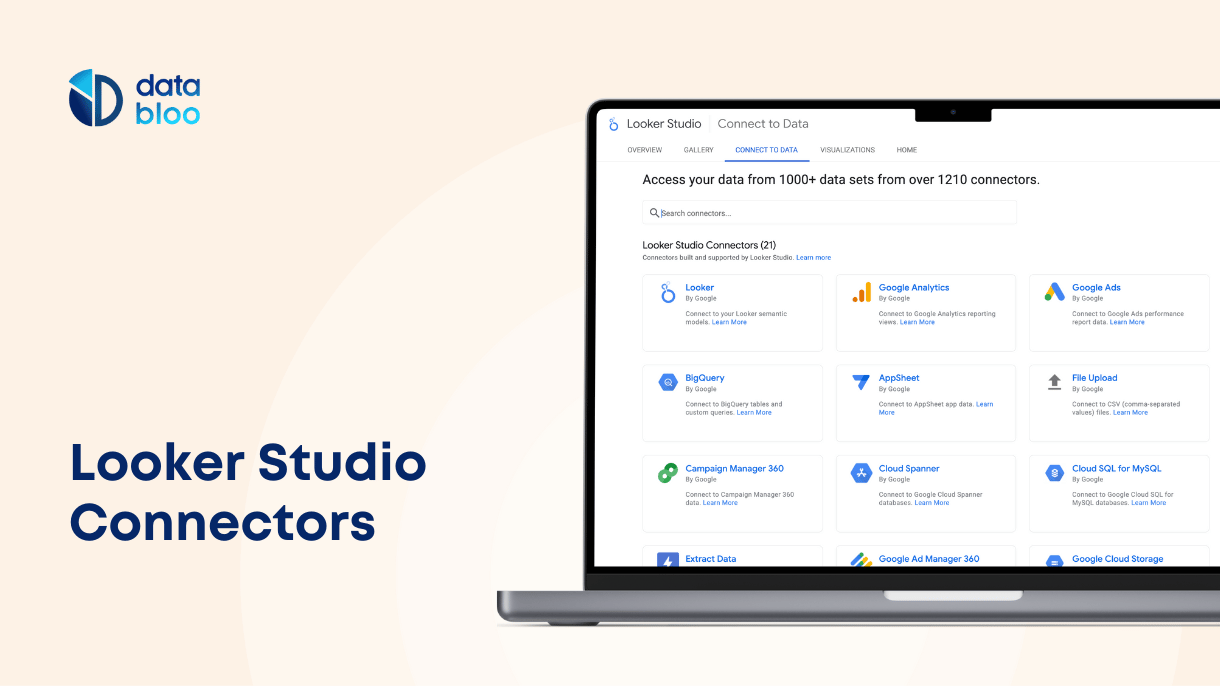
And how we can do this? Through Google Looker Studio. However, Looker Studio requires external connectors in order to import data from non native (not built by Google) properties such as Facebook and Instagram ads and that means additional monthly marketing costs.
In this post, we present two options on how to connect Facebook Ads with Looker Studio, free of cost.
Why you should connect Facebook Ads to Looker Studio
Connecting Facebook Ads to Looker Studio (previously Data Studio) provides a number of benefits to marketers and businesses. Here are some of the reasons why you should consider connecting Facebook Ads to Looker Studio:
- Consolidate your marketing data: By connecting Facebook Ads to Looker Studio, you can consolidate your advertising data from multiple platforms into a single location. For instance, you can include Facebook Ads and Google Ads data under the same report, making it easier for you to track your advertising campaigns and get a comprehensive view of your marketing performance.
- Analyze data in real-time: Looker Studio allows you to analyze data in almost real-time, which means you can get up-to-date information on how your advertising campaigns are performing. This can help you make better decisions on how to optimize your marketing spend based on the campaigns’ results.
- Collaborate with your marketing team: Looker Studio allows multiple users to access and collaborate on reports. This means you can share reports with your colleagues, stakeholders, or clients, and work together to optimize your advertising campaigns.
Overall, connecting Facebook Ads to Looker Studio can provide businesses with a centralized solution for analyzing their advertising data, optimizing their campaigns, and collaborating with team members.
Adveronix (Free Google Sheets add-on)
Adveronix is a Google Sheets add-on that enables you to pull data from your Facebook ads account or your Facebook page (and other data sources) and automate your reports with Google Looker Studio. Additionally, you can easily save your own custom reports on a Google Spreadsheet and then schedule these reports to run automatically.
7 steps to connect Facebook ads with Google Looker Studio [Adveronix]
Setup time: 10 minutes
- Install Adveronix on your account.
- Create a new spreadsheet and launch Adveronix. Add new tabs for each custom report you want to build and name them accordingly.
- Log in with your Facebook Account. For this process, you will be redirected to Facebook in order to authenticate your account. Make sure that your FB account has access to a Facebook Ads Manager.
- Create the reports. From the configuration table, select your Ad Account (you can select up to 2 Ad Accounts) and then add the metrics and dimensions for your reports. You can choose from a wide variety of metrics such as Impressions, Amount Spent, Link Clicks, Purchases, and dimensions such as Day, Campaign Name, Country, Age, and Gender.
- Save and schedule the reports (for instance hourly, daily, weekly, monthly – how often to run your reports)
- Add the new data sources on Looker Studio. Select Google Sheets as Looker Studio connector, and then the Facebook Ads file you have already created.
- Add new custom metrics (if any). Regarding metrics, it would be better to create the ratios such as CTR, CPC on Looker Studio for higher accuracy.
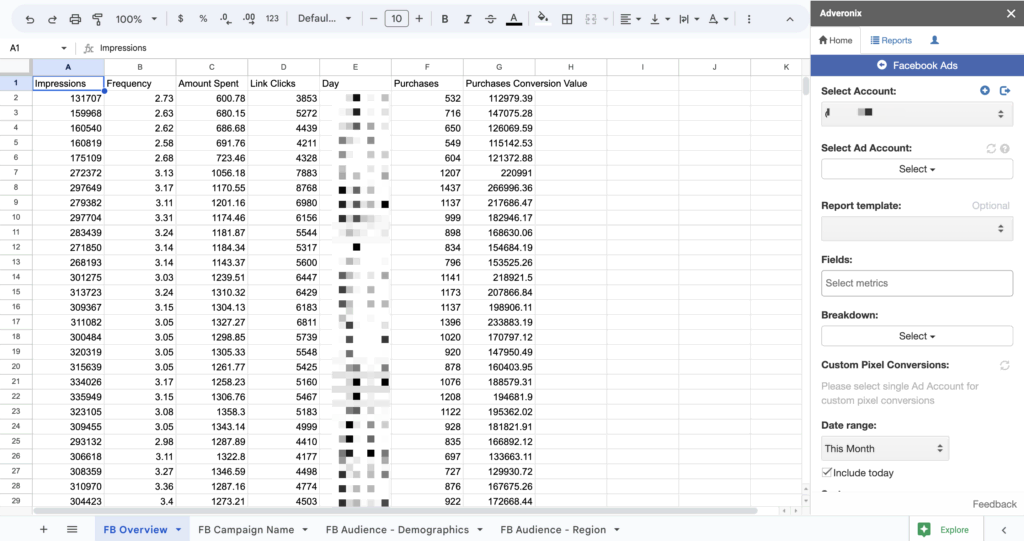
Some limitations to consider for this workaround is your extra effort for the setup and maintenance of the report. As you imagine, it might needs some time and effort from your side to build the reports from scratch. In addition, maintenance issues might come up over time, so you should fix them in order your Looker Studio report to display the data properly. Last but not least your reports cannot pull the data in real time, as you can schedule reports to run them every hour.
On the other side, this workaround is free of charge, without increasing your monthly fees for marketing connectors.
Data Bloo (Free Looker Studio Connector)
The second way to connect your Facebook Ads data with Looker Studio for free is by using Data Bloo’s connector. Data Bloo provides a free connector that enables you to easily import and present your Facebook ads data on Looker Studio in less than 2 minutes. So in case you are looking for a quick and easy way to sync Facebook with Looker, this connector is the best option.

3 steps to connect Facebook with Looker Studio [Data Bloo]
Setup time: 2 minutes
- Open your Looker Studio and go to the data sources. Search for “Data Bloo” from the top right filter and select the Facebook Ads connector. Alternatively you can open our dedicated page to access the connector directly.
- Authorize the connector by selecting your Facebook Ads credentials.
- Select your Facebook Ads account and use our default report template to start your analysis. Please note that you can select multiple / all accounts in the configuration tab for your reports.
The process for connecting Facebook Ads with Looker Studio using Data Bloo’s Connector is similar to using any other paid Facebook Ads connector. The best part is that it is completely free!
Top Facebook Ads metrics for your reports
Now that you’ve learned two free ways to integrate your Facebook Ads data with Looker Studio, it’s crucial to focus on the key metrics and dimensions that will help you analyze and optimize your campaigns effectively. By tracking these essential KPIs, you can gain actionable insights into your ad performance and drive better results for your business. Let’s explore the most important metrics and dimensions to include in your Facebook Ads reports:
Facebook Ads Metrics
- Impressions: The total number of times your ads were on screen.
- Frequency: The average number of times each user sees your ad.
- Link Clicks: The number of clicks on links within the ad leading to the advertiser-defined destination.
- CTR (Click-Through Rate): Measures the percentage of people who clicked on the link in your ad.
- Results: The specific outcomes from your ad, such as purchases or leads.
- Result Rate %: The percentage of results relative to the number of link clicks.
- Cost Per Result: The average cost for each result achieved.
- CPC (Cost Per Click): The average cost incurred for each link click.
- CPM (Cost Per Mille): The cost per 1,000 impressions.
- Amount Spent: The total expenditure on the campaign during the given period.
Facebook Ads Dimensions
- Publisher Platform: The platform where the ad was published, such as Facebook, Instagram, or Messenger.
- Campaign Name: The advertising campaign of you Facebook Ads.
- Adset Name: The name of the ad set within the campaign.
- Ad Name: The individual name of the ad.
- Device Platform: The type of device used to view the ad, such as desktop or mobile.
- Country: The country from which your ads were viewed.
- Region: The specific region within the country where your ads were seen.
- Age: The age range of the audience who viewed the ads.
- Gender: The gender distribution of the audience that interacted with your ads.
Tracking these KPIs allows you to get a comprehensive view of your campaign’s performance, helping you make informed decisions. For a deeper dive into each of these metrics and how to use them effectively in your reports, check out our detailed guide on Facebook Ads KPIs.
How to use a ready-to-use Looker Studio Template for Facebook Ads
We know the importance of reporting the right data and how it would take to design from scratch a comprehensive report. For this reason, we created a Facebook Ads Looker Studio Report Template using one of the above solutions that don’t require any other subscription.
Once you purchase this dashboard you will be able to sync your Facebook ads data with the template and track the performance of your paid activities across Facebook, Instagram, and Messenger. Additionally, by using this report, you can:
✓ report the Facebook KPIs for Ads Visibility, Conversion, Acquisition, and Cost
✓ measure the engagement across platforms and your top-performing campaigns
✓ track the behavior of your audience
✓ get a high-level monthly snapshot (over time)
You can check our dashboard which includes all the above information with the below link. Have in mind that this report comes with step-by-step instructions and video tutorials for the technical setup.

