Table of Contents
In this article we’ll cover ins and outs of one of the most useful Google Ads reports, Google Auction Insights, and share practical advice on using this report to improve your ad performance.
Let’s dive in.
What Are Google Auction Insights?
Google Auction Insights is a report accessed via Google Ads platforms that shows how your Google advertising campaigns compare to your competitors that bid for the same auctions/terms.
The report will help you become strategic about your bidding.

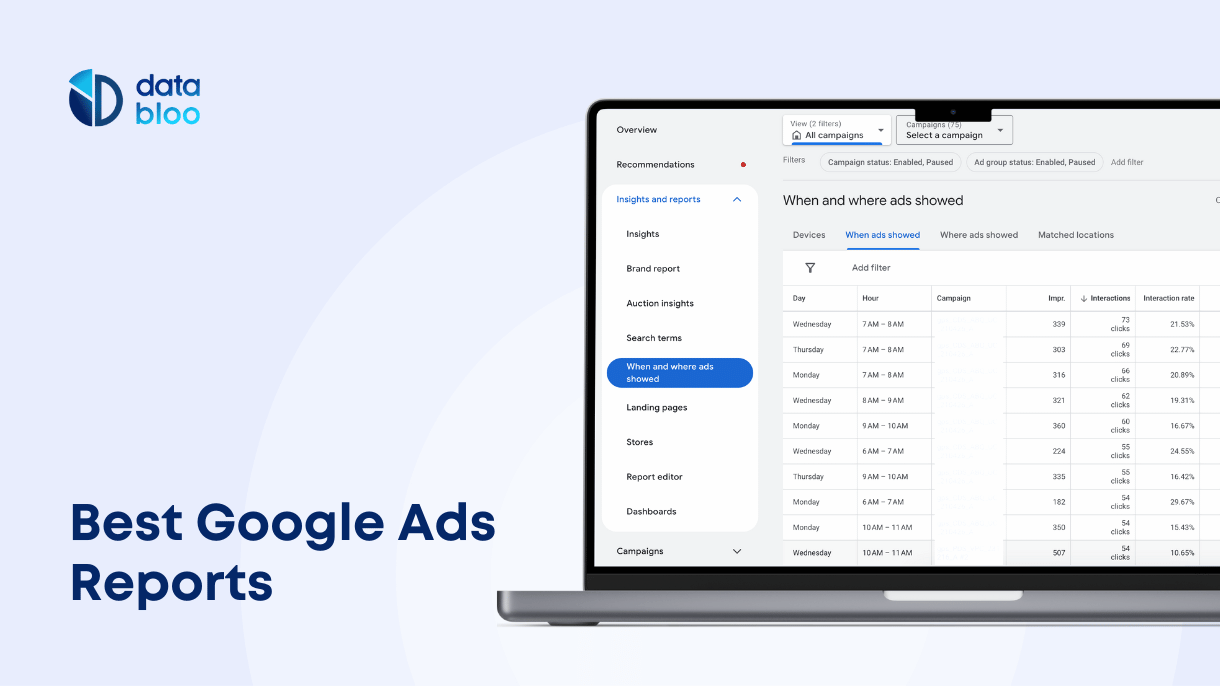
To access this report, open Google Ads , go to Campaigns tab on the left, and there Insights and Reports – Auction Insights

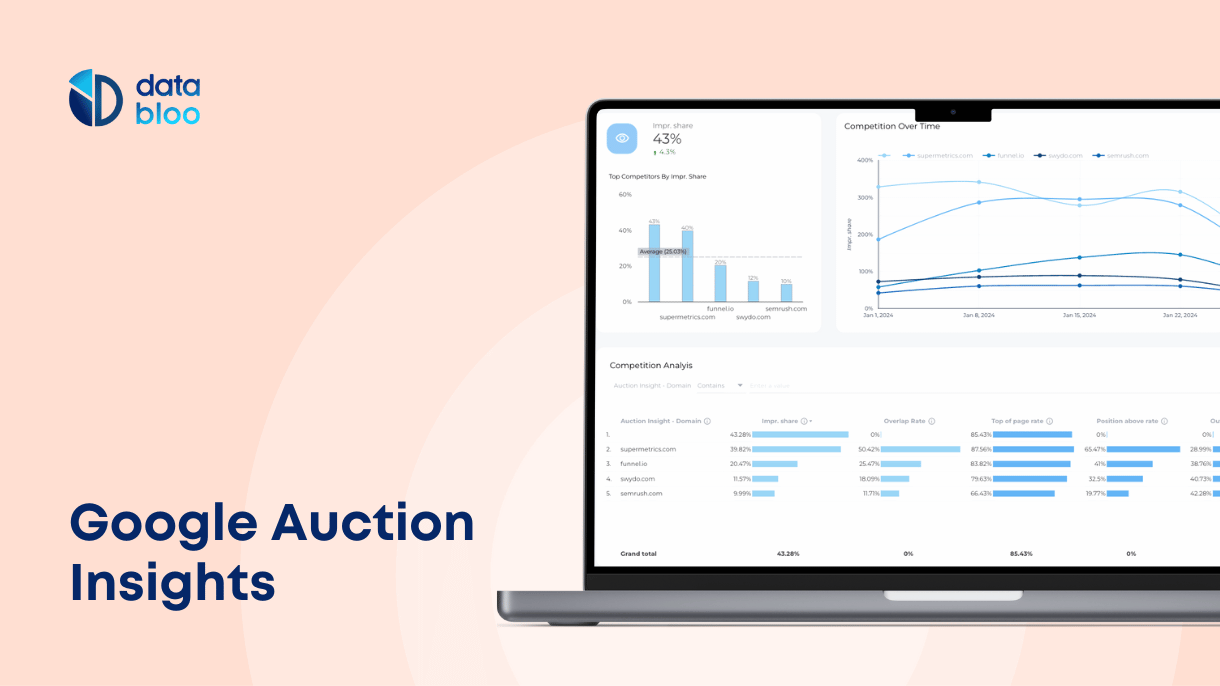
Google Auction insights report shows several different metrics that will help you analyze your bidding from different angles:
- Impression share
- Overlap rate
- Position Above Rate
- Top of Page Rate
- Abs. Top of Page rate
- Outranking share
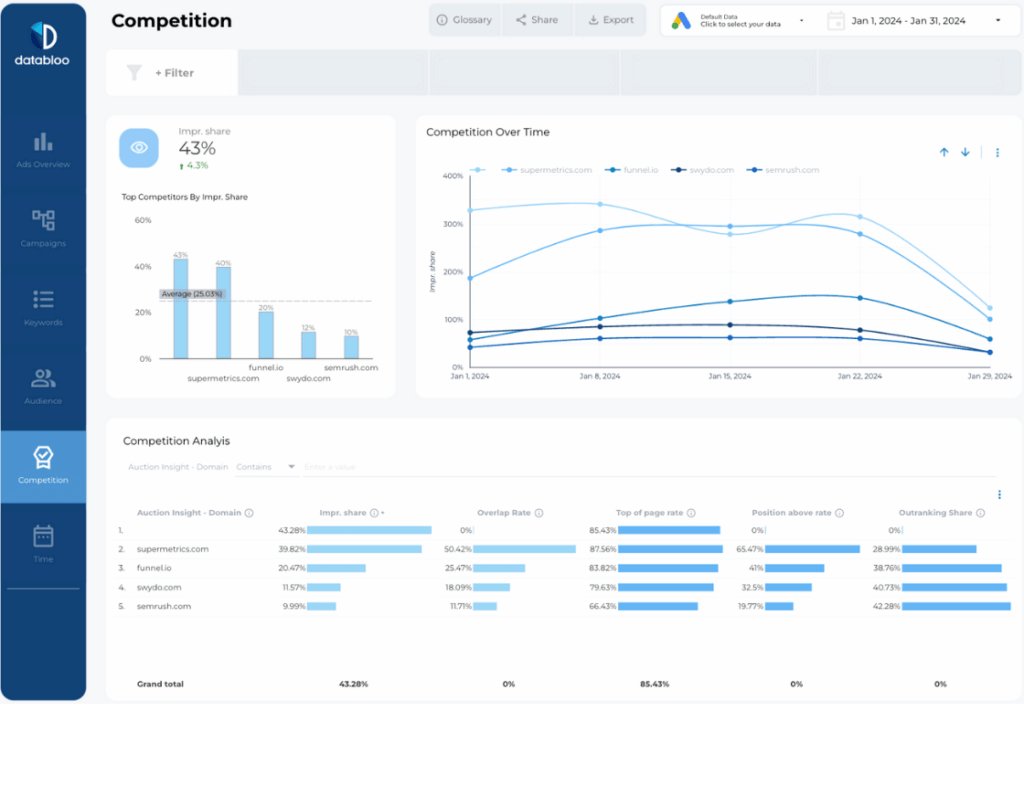
After a recent update from Google on August 24, 2024, auction insights are no longer available outside from Google Ads interface. This means you cannot use metrics and dimensions related to competition, such as impression share and auction insights by domain, in third-party BI tools or Looker Studio. Therefore, if you check an old report like the one above, you will notice that this data is missing from the official Google Ads Looker Studio Connector.
Impression share
The auction insights report shows not only your impression share but also the impression share of other advertisers competing in the same auctions as you, so you can compare your performance to your competitors
In simple terms, it’s an indirect metric of how much shows your competitors spend on ads in this group or campaign.
If your impression share is low, that means you are being outspent or sometimes outclassed by your competitors, and that might affect your conversions and position in search.
Try not to focus too much on this metric, and treat it more like an overview of a bird-eye view of your ad positioning.
To improve Impression share, consider bidding more or increasing Quality Scores of your ads.
Competitor #1: 65% will mean that this competitor’s ads are shown in 65% of searches.
Overlap rate
The ‘overlap rate’ measures how often your ad appears alongside a specific competitor’s ad in the same auction results. It’s the percentage of your impressions that coincide with that competitor’s impressions.
The higher the overlap % is, the more often this particular competitor bids for the same terms as you are.
This metric is useful in understanding who your true competitors are and might prompt you to study with more focus bidding strategies and ad campaigns of competitors that you overlap with the most.
Competitor XYZ 60% overlap share means that for 60^ of keywords you bid on, this competitor bids as well
Position above rate
Position above rate means how often a competitor’s ad is above yours when both ads are shown together in search results. It’s calculated as a percentage of the times your ads are together.
This metric shows only for search campaigns.
It’s useful to see how often your competitors’ ads pop up higher than yours. Typically, this metric correlates directly with conversions.
Track over time how position above rate affected conversions as typically people click the links that are higher in search more often.
Competitor #5 10% position above rate would mean this specific competitor’s ads appear higher than yours only in 1 out of 10 searches.
Top of page rate
Top of page rate means the percentage of the time an ad is above the organic results. This is for your ads or others, depending on the row you’re looking at in the report.
Important: not above other ads, but above organic search results. If your ad is the lowest among all ads at the top of the page, it’s still considered above organic search results.
Example: If your ad receives 1000 impressions and 100 of those are above organic search results, your top of page rate is 10%.
Abs. top of page rate
Top rate means the percentage of your ad impressions that are in the very top position of all ads. This helps you know if changes in performance are due to changes in ad position.
Note: This metric only includes data from Google Search, not Search Partners.
Most top spenders will have the highest % here.
Outranking share
Outranking share’ measures how frequently your ad performs better than a specific competitor’s ad in search results. It includes two scenarios:
- When your ad appears in a higher position than the competitor’s ad
- When your ad is shown but the competitor’s ad is not displayed at all
Segment Report By Device and Or Time of The Week
In the top right area of this report, you can see a Segment button. Use it to segment your report by device or specific time of the week.
Sometimes segmentation might prove useful as you will notice that your competitors are not bidding as much on specific days of the week or on specific devices.
Why You Need The Auction Insights Report
Polish Your Strategy. Get a clear view of your competition so you can refine your ads.
Optimize Your Spend. See where your ad spend is working the hardest and adjust your budget accordingly.
Find Gaps. Identify gaps in your advertising coverage and new areas to grow.
Analyze Competitors. See what your competitors are doing and how they’re performing so you can do the same.
Competition Types. Distinguish between direct competitors and indirect overlap so you can focus on what matters most.
Ready to Take Your Google Ads Reporting To The Next Level?
Data Bloo offers a wide range of ready-to-use white-lable real-time automated reports for agencies and consultants who want to take their client reporting to the next level.
One of our most popular reports for Google Ads is Essential Google Ads Template. Try the report for free, connect it to your Google Account, and keep your clients informed and impressed from now on!

