Table of Contents
Imagine you’re an enterprise marketing manager overseeing a complex organization with multiple departments and diverse operational facets.
Your challenge lies in effectively communicating the performance of your SEO strategies to the senior management team and colleagues from other company departments.
But standard SEO dashboards, often reliant on Google Search Console data, tend to provide a broad, global perspective on page and query data without enough data to convey specific insight. Or you find yourself constantly adjusting your enterprise SEO reports because so many different people need to understand what you want to share.
A proper enterprise SEO dashboard will be a welcome relief. It can combine data from various sources to create different reports that you can use to tie to your company’s goals and profitability.
In this guide, we’ll look at crucial components of enterprise SEO reporting and how to combine them all in a balanced enterprise SEO dashboard to showcase your SEO performance.
What’s an Enterprise SEO Dashboard?
An Enterprise SEO dashboard is a centralized SEO reporting tool or software that helps you track and monitor the success of your specific SEO goal and objective.
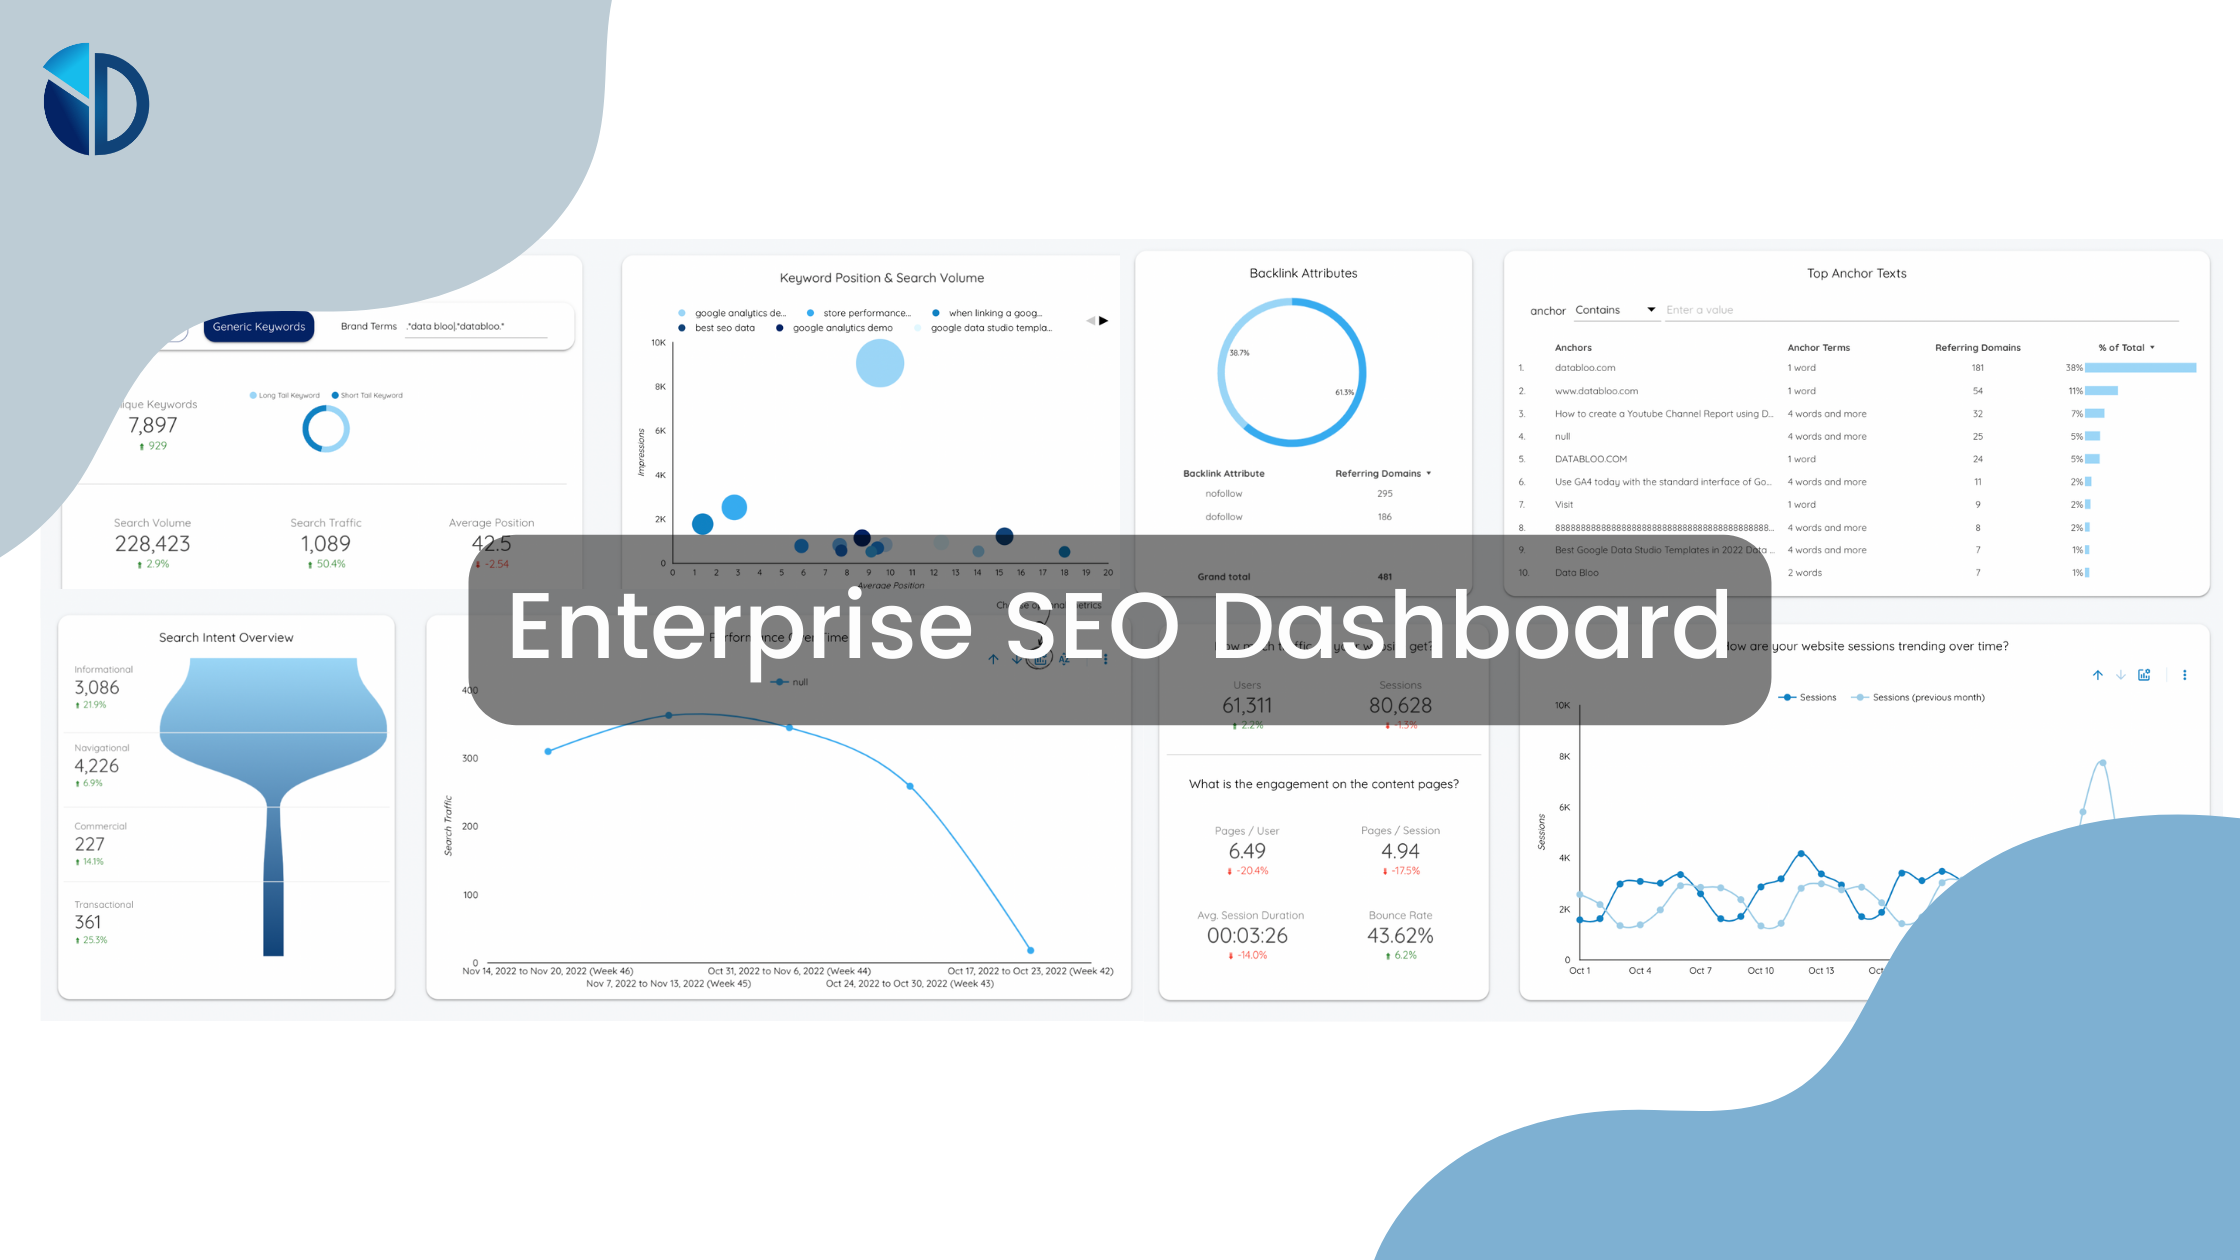
The dashboard consolidates the data of hundreds of pages from diverse sources—think GSC, GA4, Ahrefs, and other tools to show a highly specific aspect of your website. E.g., a report on revenue attribution to specific location-based keywords.
Enterprise dashboard also covers the needs of different enterprise scenarios, be it national distributors with hundreds of physical locations, digital corporations, or multi-thousand pages e-commerce stores.
An enterprise SEO dashboard is different from any other SEO dashboard. Here’s how:
- An enterprise SEO dashboard is suitable for C-suite level reporting. It focuses on a small set of key business metrics (traffic, conversion, SEO ROI) and shows metrics that clearly correlate with business goals and objectives.
- Easy to switch between high-level and granular SEO data. C-suite is usually concerned with border business metrics and how SEO ties to them, like ROI, traffic, and conversion. Often, they may not even look at more granular data such as individual keyword performance.
However, enterprises often compete for keywords that generate tens of thousands of visitors per month, and even a small shift in rankings for these keywords has a huge effect on business bottom line. A well-designed enterprise dashboard can help quickly switch between high-level data (overall traffic etc.) and granular SEO data, e.g, how your company is ranking for major keywords VS. competition in local searches.
Pro tip: CEOs can catch you off guard with follow-up questions (some details may interest them more than others) or ask different things at once – having more granular SEO data somewhere close in an enterprise dashboard will help you never be caught off guard.
- More focused on larger scale dynamics. Enterprise websites often include hundreds of pages, and technical SEO impacts all pages (stores, databases). Often enterprise tactics are preferable because they ARE scalable and can have a positive impact across all websites. So your enterprise dashboard needs to help you easily see the impact of larger scale SEO campaigns
- Designed for scale and volume. The dashboard consolidates data from various websites, campaigns, and channels into a centralized location, showing the overall SEO performance across the organization. You can quickly identify trends, patterns, anomalies, and areas that require attention because of its efficient monitoring capabilities, even with large volumes of data.
- Offers multi-domain management. An enterprise SEO dashboard is capable of managing multiple domains and subdomains, making it possible to monitor and compare the performance of different locations efficiently. It also offers centralized control and coordination making it possible for different departments to work towards common objectives.
- Provides multi-channel insight. Enterprise SEO dashboard integrates data from various sources (GSC, GA4, social media, review sites, etc.), allowing you to see how campaigns on different channels work together, scale up successful platforms campaigns and quickly remove inefficient strategies.
9 Enterprise SEO Reports And How to Present Each
An enterprise SEO report tells the story behind your digital marketing efforts, combining data from rankings, crawls (Ahrefs, Semrush, Screaming Frog), and much more.
The reports should be clear and relevant enough to give intricate metrics, achievements, and future forecasts, to guide different stakeholders.
Here are 9 different reports you need in your enterprise SEO dashboard:
1. Brand vs. Generic Keywords SEO Report
Branded keywords are specific queries that include your brand name, company, product or service. They are unique to your brand and often yield a higher conversion because the user is more intentional.
Generic keywords include broad terms that are not attributed to a specific brand. They reach larger audiences and represent the initial stages of the user’s search intent.
Here’s why you need the brand vs. generic report in your enterprise SEO dashboard:
- Brand visibility and recognition. Branded keywords help you assess how well your brand is recognized. You can monitor brand perception and marketing effectiveness.
- Competitive analysis. You can monitor your brand’s performance and compare it with competition to identify opportunities and challenges.
- Clarity of user intent. Generic keywords give insights into what your users want, and you can tailor your content strategy accordingly.
- Search rankings. While you’ll easily rank for branded keywords, you need to maintain a strong presence on Search by capturing a broader audience using generic keywords.
Here’s an example of a branded vs generic keywords SEO report:

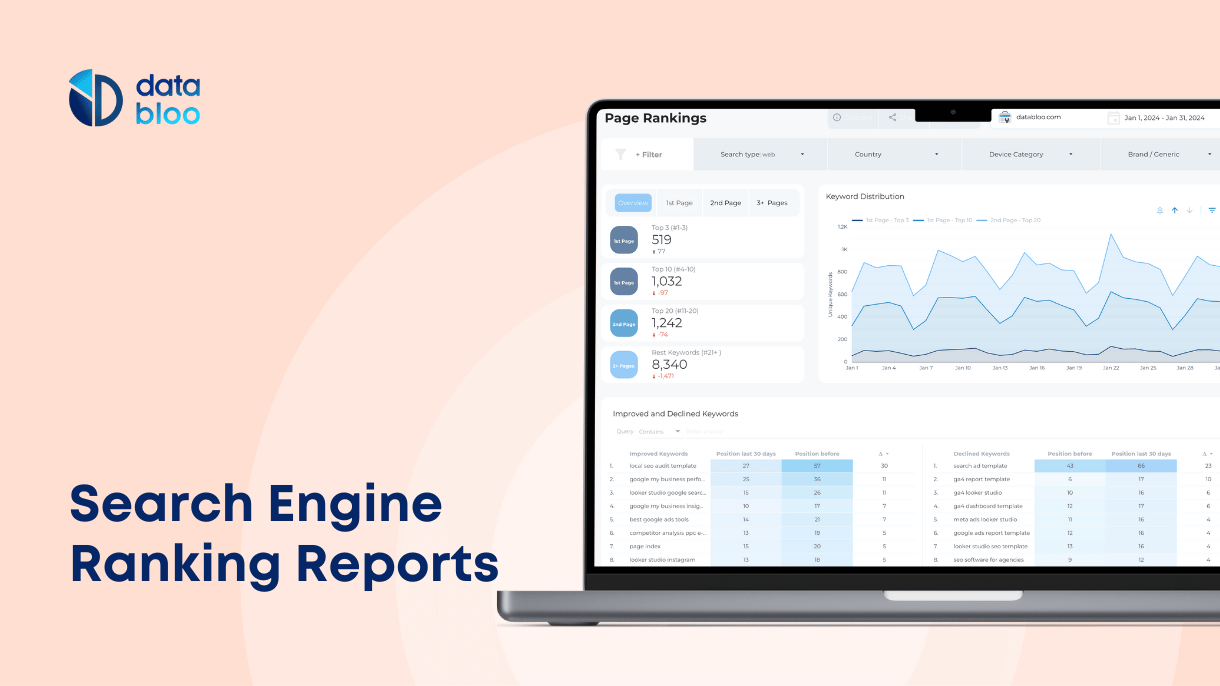
2. Keyword Analysis Report
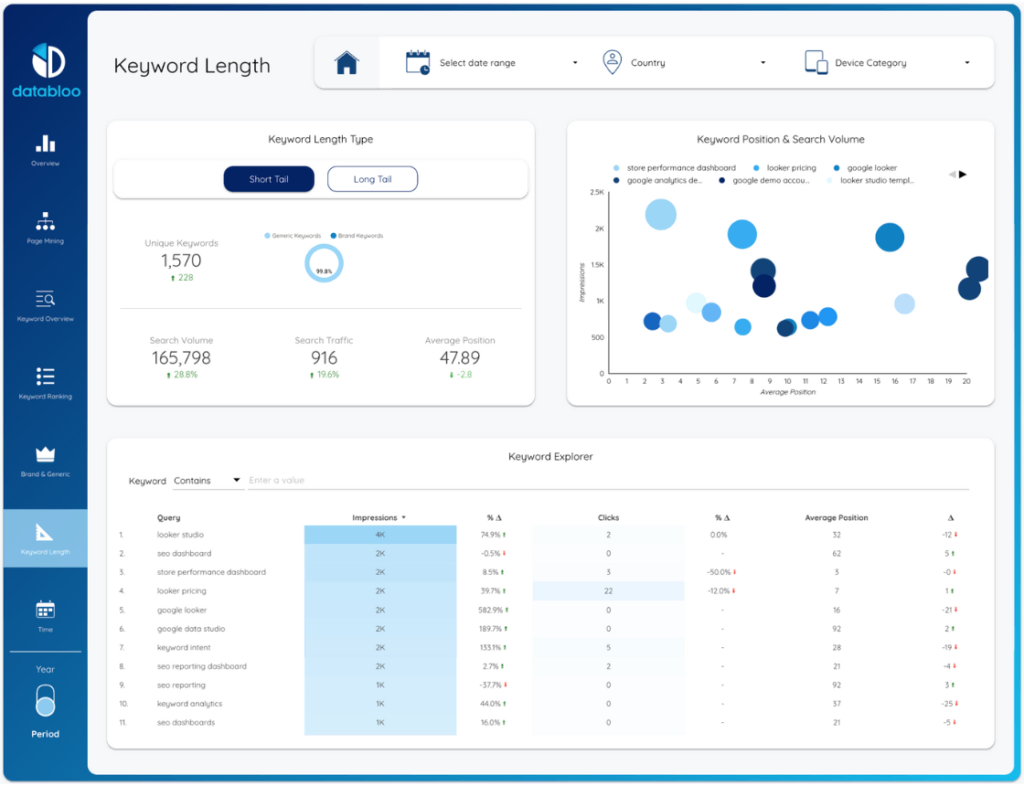
A keyword analysis report shows you how well specific keywords are performing. This may include:
- Average position on SERPs
- Search volume- Number of monthly searches for each keyword
- Competition How many websites are targeting the same keywords
- Percentage of users who click on your link for the related keyword (Click-Through Rate)
- Organic traffic generated from the keyword
- Keyword conversion data
- Highest performing keywords
- How your long-tail keywords compare with short-tail keywords
Here’s an example of a keyword analysis report on an enterprise SEO dashboard.
3. Keyword Search Intent Report
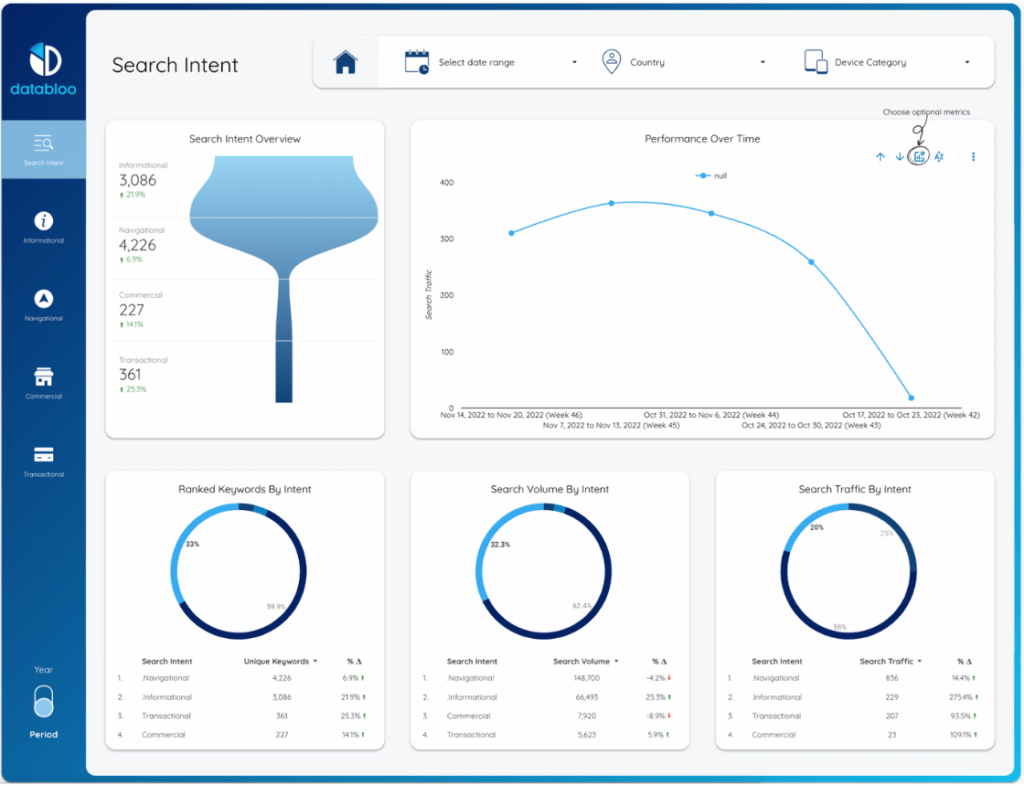
The keyword search intent optimizes data from Google to give you customer motivations behind every search query. This data can be used to create content fit for every user journey and intent.
Search intent queries can be:
- Informational / Awareness
- Navigational/ Interest
- Commercial/Desire
- Transactional/Action
Here’s an example of a keyword search intent report.
4. Backlink Report
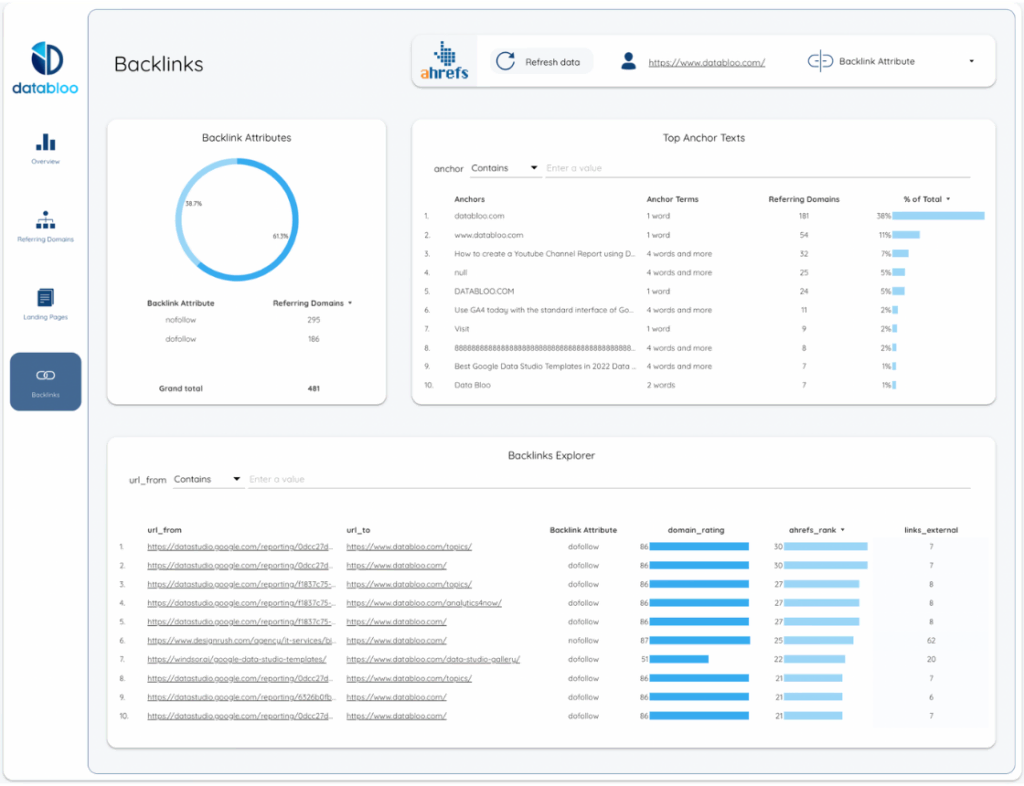
The Backlink profile report on your enterprise SEO dashboard shows you your site’s backlink performance. Backlinks help determine your website’s authority and relevance.
By integrating your enterprise dashboard with a tool like Ahrefs, your backlink profile report helps you:
- Compare how your backlinks compare with competitor websites.
- know how many backlinks your website has, and where they come from.
- The top referring domains to your website.
- Most common anchor texts used for your backlinks.
- The number of backlinks on your top landing pages.
Let’s look at a comprehensive backlink report with Ahrefs integration.
5. Content Performance Report
The content performance report helps you measure how well your content is performing. The report sheds light on key metrics like page views, engagement rates, and conversion rates.
The report also shows you:
- How your content has performed over time
- The most popular content categories for your readers
- The most engaging content types, e.g., articles, newsletters, videos, etc.
- The demographics of your readers
- New and returning readers to your website and how they behave after reading
- The time they spend on your content pages
Let’s look at an example of a content performance report.

6. Traffic Sources Report
The report gives detailed insights on the various channels through which visitors arrive at your website. Traffic sources include organic search, paid search, direct traffic, referral traffic (backlinks and partnerships), and social media traffic.
Traffic sources report helps you evaluate the performance of different channels. In an enterprise SEO dashboard, this report helps you show the ROI of your SEO efforts and campaigns. For instance, if you have considerable traffic from your referral sources, it’s an indication that your brand authority is growing.
Here’s an example of a traffic report in an enterprise SEO dashboard.

7. Local SEO Report
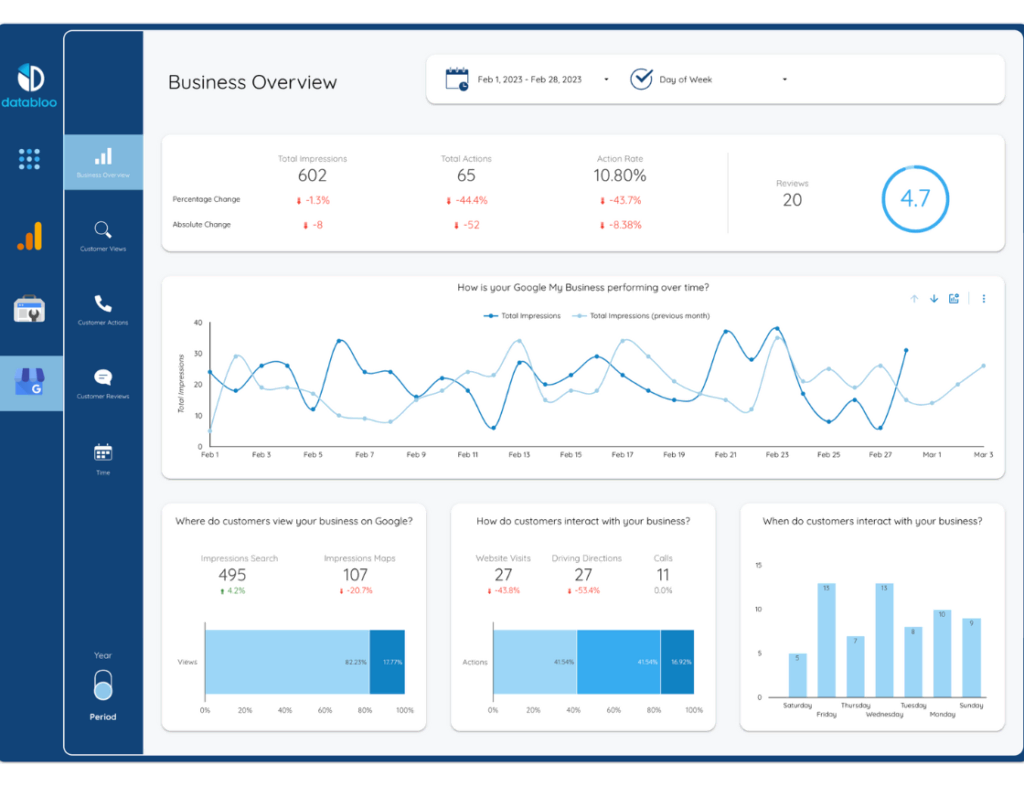
A local SEO report shows your website’s performance in local search results. In enterprise SEO, each of your business locations should be optimized and relevant to the local area.
Data from local SEO reports comes from local keyword rankings, online reviews, Google My Business (GMB), etc.
In an enterprise SEO dashboard, the Local SEO report tracks and measures the effectiveness of your Local SEO efforts. It acts as a centralized monitoring system for your online presence in multiple locations.
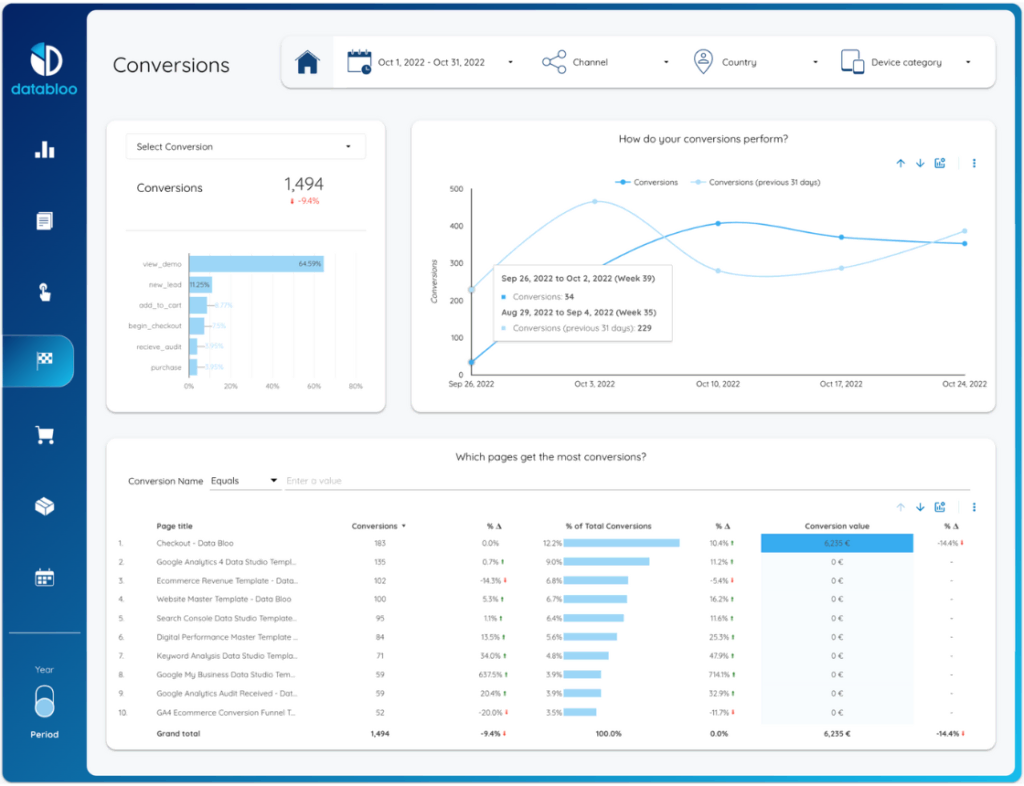
8. Conversions Report
A conversion report is an analysis of the actions your website visitors take after consuming your web content. A conversion can be filling out a contact form, subscribing to a newsletter, making a purchase, etc.
The conversion report provides essential insights into the effectiveness of an enterprise’s SEO strategy. You can compare your conversion report with the revenue generated to know if your SEO efforts are impacting the business’s bottom line.
A conversion report can help you know:
- User trends over time
- The marketing channels your users come from
- The most engaging pages
- Your best-performing events
- Your top-selling products, services, or brands
A robust conversion report will also help you identify high-performing pages and help you refine your SEO tactics for better performance.
Let’s look at an example of a conversion report below:
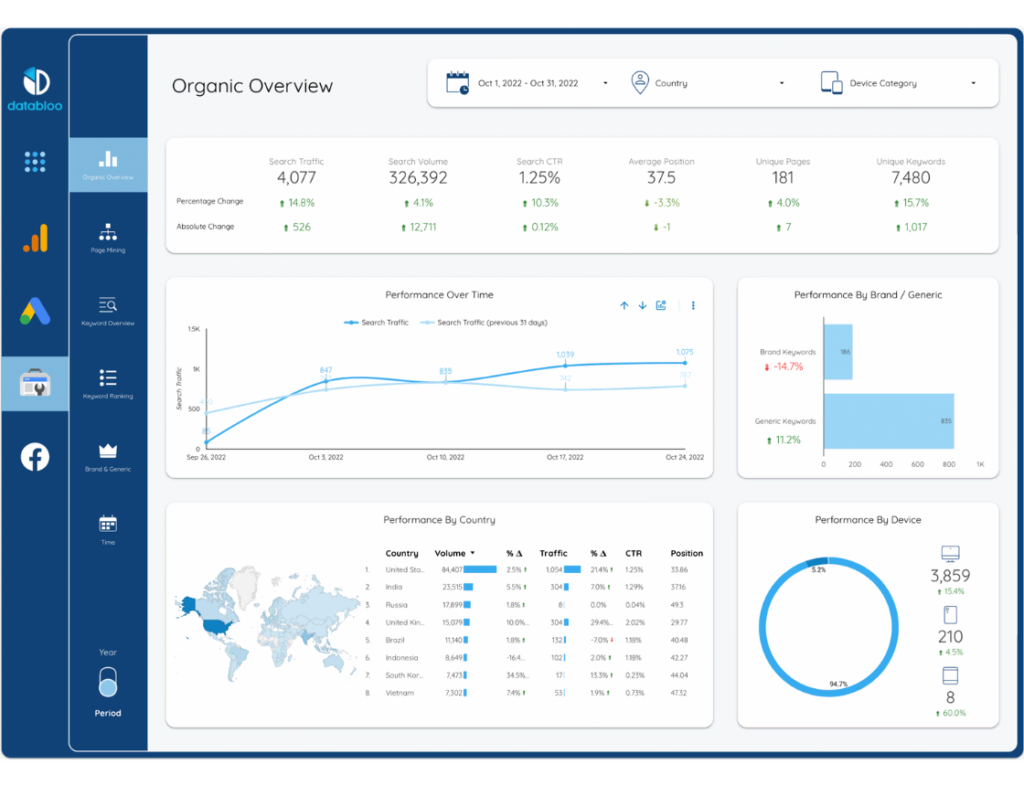
9. Organic Search Traffic Report
Organic Search traffic refers to visitors coming to your website from unpaid search engine results.
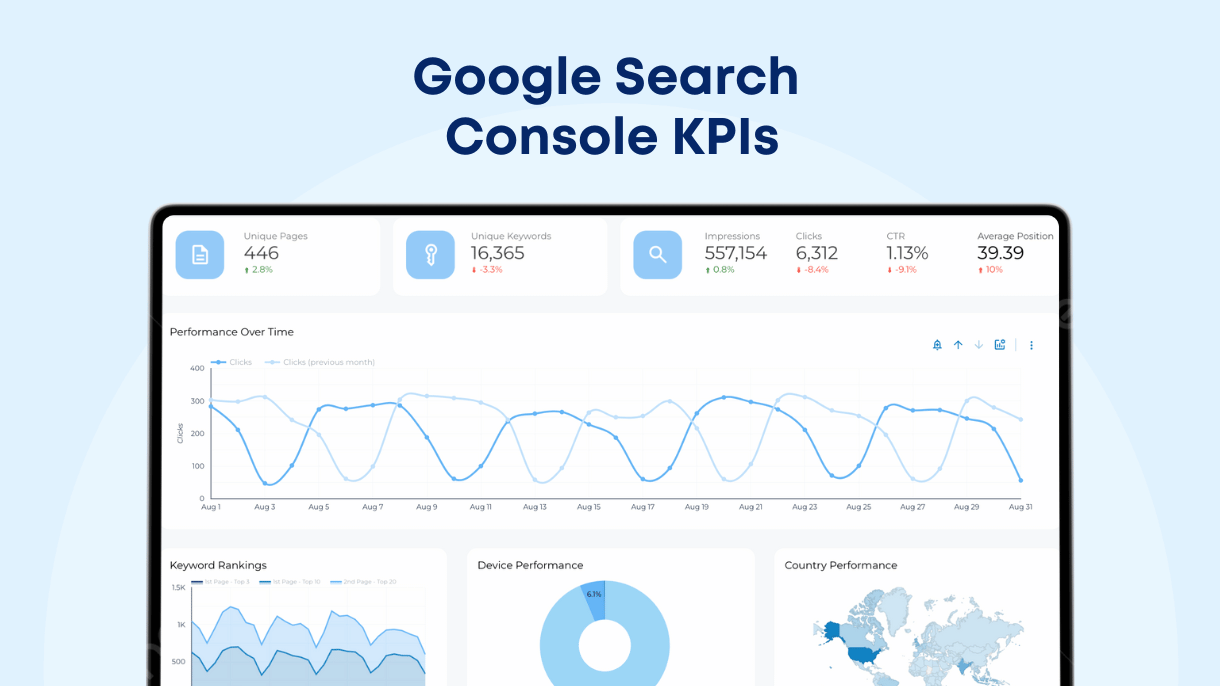
In an enterprise SEO dashboard, organic search traffic metrics highlight your website’s performance and visibility on search engine results.
Here’s what this report helps you show in your dashboard:
- Organic search traffic is a direct indicator of how well your website is performing in search engine rankings.
- The report shows the effectiveness of your SEO strategies like content optimization, keyword targeting, and backlink building.
- You can use organic search traffic to measure SEO ROI and use it to justify SEO budgets and resource allocation.
- You can use data like time on page and bounce rate to get insights on user engagement and experience.
Tips on Using Enterprise SEO Dashboard
The goal of an Enterprise SEO dashboard is to make your executives give a nod to your SEO plans. Of course, besides helping you get search performance, conversion, and user intent trends.
Let’s look at some ideas on using an enterprise SEO dashboard to highlight the impact of your SEO work (and plans for success with SEO).
Tip #1 Avoid SEO Jargon
Not everyone in your executive team understands SEO concepts, so it’s good to steer clear of excess SEO lingo. Make your SEO reports clear and as easy to understand as possible.
Tip #2 Tie your Metrics to Specific Business Goals
Don’t just present SEO numbers as they are.
Since SEO is a means to an end of revenue, brand visibility, and market share, use each insight (if possible) to show how it contributes to your company’s growth plans.
Tip #3 Don’t Leave Out Your Competition
Every executive wants to know how their competition is doing. Use competitive insights on your enterprise SEO dashboard to showcase your competitors’ progress.
Competitor reports are a benchmark of your performance, and they can help identify opportunities in your industry even as you present your SEO performance data.
Tip #4 Close Off your Report by Summarizing Key Takeaways
A key takeaway gives each reader an action point as soon as they get your SEO report.
Key takeaways ensure the most significant insights are communicated clearly, and your executives can make informed decisions and prioritize issues that need immediate actions.
Enterprise SEO dashboard is more than a tool; it’s one of the most efficient ways to put everyone in your company on the same page when it comes to efficiency and ROI of your SEO marketing efforts.
Embracing this powerful tool can lead to more informed strategies, better resource allocation in SEO, and ultimately, a stronger, and more successful enterprise SEO marketing campaigns.

