Table of Contents
Did you know that 94% of first impressions relate to your business website design?
This is why every business needs to create a captivating, interesting website to help engage with potential customers. How your website looks and works represent your brand to the world.
If you’re thinking about optimizing your website experience, the best way to do that is with your website analytics data. This is data taken from platforms like Google Analytics and can be used with dynamic analytics templates to help you find out how to improve your online performance.
Want to learn more about improving website performance for your business? Here’s what you need to know about designing a website focused on the customer experience.
The Importance of Analytics Reporting
Analytics is incredibly important in modern business. This is because data will allow you to learn more about your audience and how to target these people with the right product. In simple terms, analytics data can be used to build the most efficient, profitable business possible.
Advantages of Using Looker Studio for Analytics Reporting
Looker Studio is the platform from Google that lets you gather your business data visually. This visual representation allows you to interact with your data in a more engaging way. The platform connects to Google Analytics 4 so that you get access to the latest website data.
Why Have an Analytics Report In Place?
Analytics reports are incredibly beneficial for digital businesses. Analytics reports allow you to measure and optimize the online performance of your business. There are several reasons why having an analytics report is crucial:
Measure Online Performance
An analytics report provides valuable insights into how well a business is performing. It provides important metrics such as website traffic, new & returning customers, conversion rates, and engagement rates that help businesses understand the effectiveness of their website and the success of their marketing efforts. By tracking such metrics, you can easily identify areas that need improvement.
Make Better Decisions
Web Analytics reporting templates provide actionable insights that help businesses make data-driven decisions about their operations, marketing, and business. For example, an analytics report might reveal that a marketing promo is not delivering the expected results or that the majority of your potential customers drop out during a specific step at the checkout.

Allocate Budget & Resources
This type of report allows businesses to allocate their budget and resources effectively by providing results into what’s working and what’s not. Having access to insights about your return on investment, you can optimize your budget and resources accordingly.
Improve Customer Experience
A Google Analytics reporting template helps businesses understand the customer behavior on their website & across their online assets and identify areas for improvement. By utilizing metrics such as bounce rates and conversion rates, you can spot trends in the different areas that are impacting the customer experience and make the appropriate actions in order to improve them. By doing that you can increase customer satisfaction, and loyalty and ultimately have more online sales.
Web Analytics KPIs To Use
Having an analytics report in place is crucial for measuring and optimizing the online performance of a business, and Web Analytics KPIs play a critical role in this process. Web analytics KPIs are key performance metrics that allow businesses to measure the success of their website. Here are some of the most important web analytics KPIs that a business should track with the help of analytics reports:

1. Acquisition KPIs:
- Total Users: The total number of unique visitors who have visited your website.
- Total Visits: The total number of visits to your website, including repeat visits from the same user.
2. Behavior KPIs:
- Average Session Duration: The average amount of time a user spends on your website during a single session.
- Bounce Rate: The percentage of visitors who leave your website without interacting with the content.
3. Conversion KPIs:
- Conversions: The number of goal completions or desired actions that the users did on your website, such as form submissions or purchases.
- Conversion Value: The monetary value of conversions (i.e. 1$ for each email submission)
- Transactions: The number of transactions or purchases made on your online store.
- Revenue: The monetary value of all transactions.
- Conversion Rates: The percentage of visitors who complete a goal or transaction on your website.
By tracking these web analytics KPIs, you can pull valuable insights into the effectiveness of your website and the success of your marketing efforts.
4 Google Analytics Templates to Use
In this section, we’ll take a closer look at four of the best web analytics reporting templates to help you make better decisions to improve your online presence and drive growth:
1. GA4 Looker Studio Template
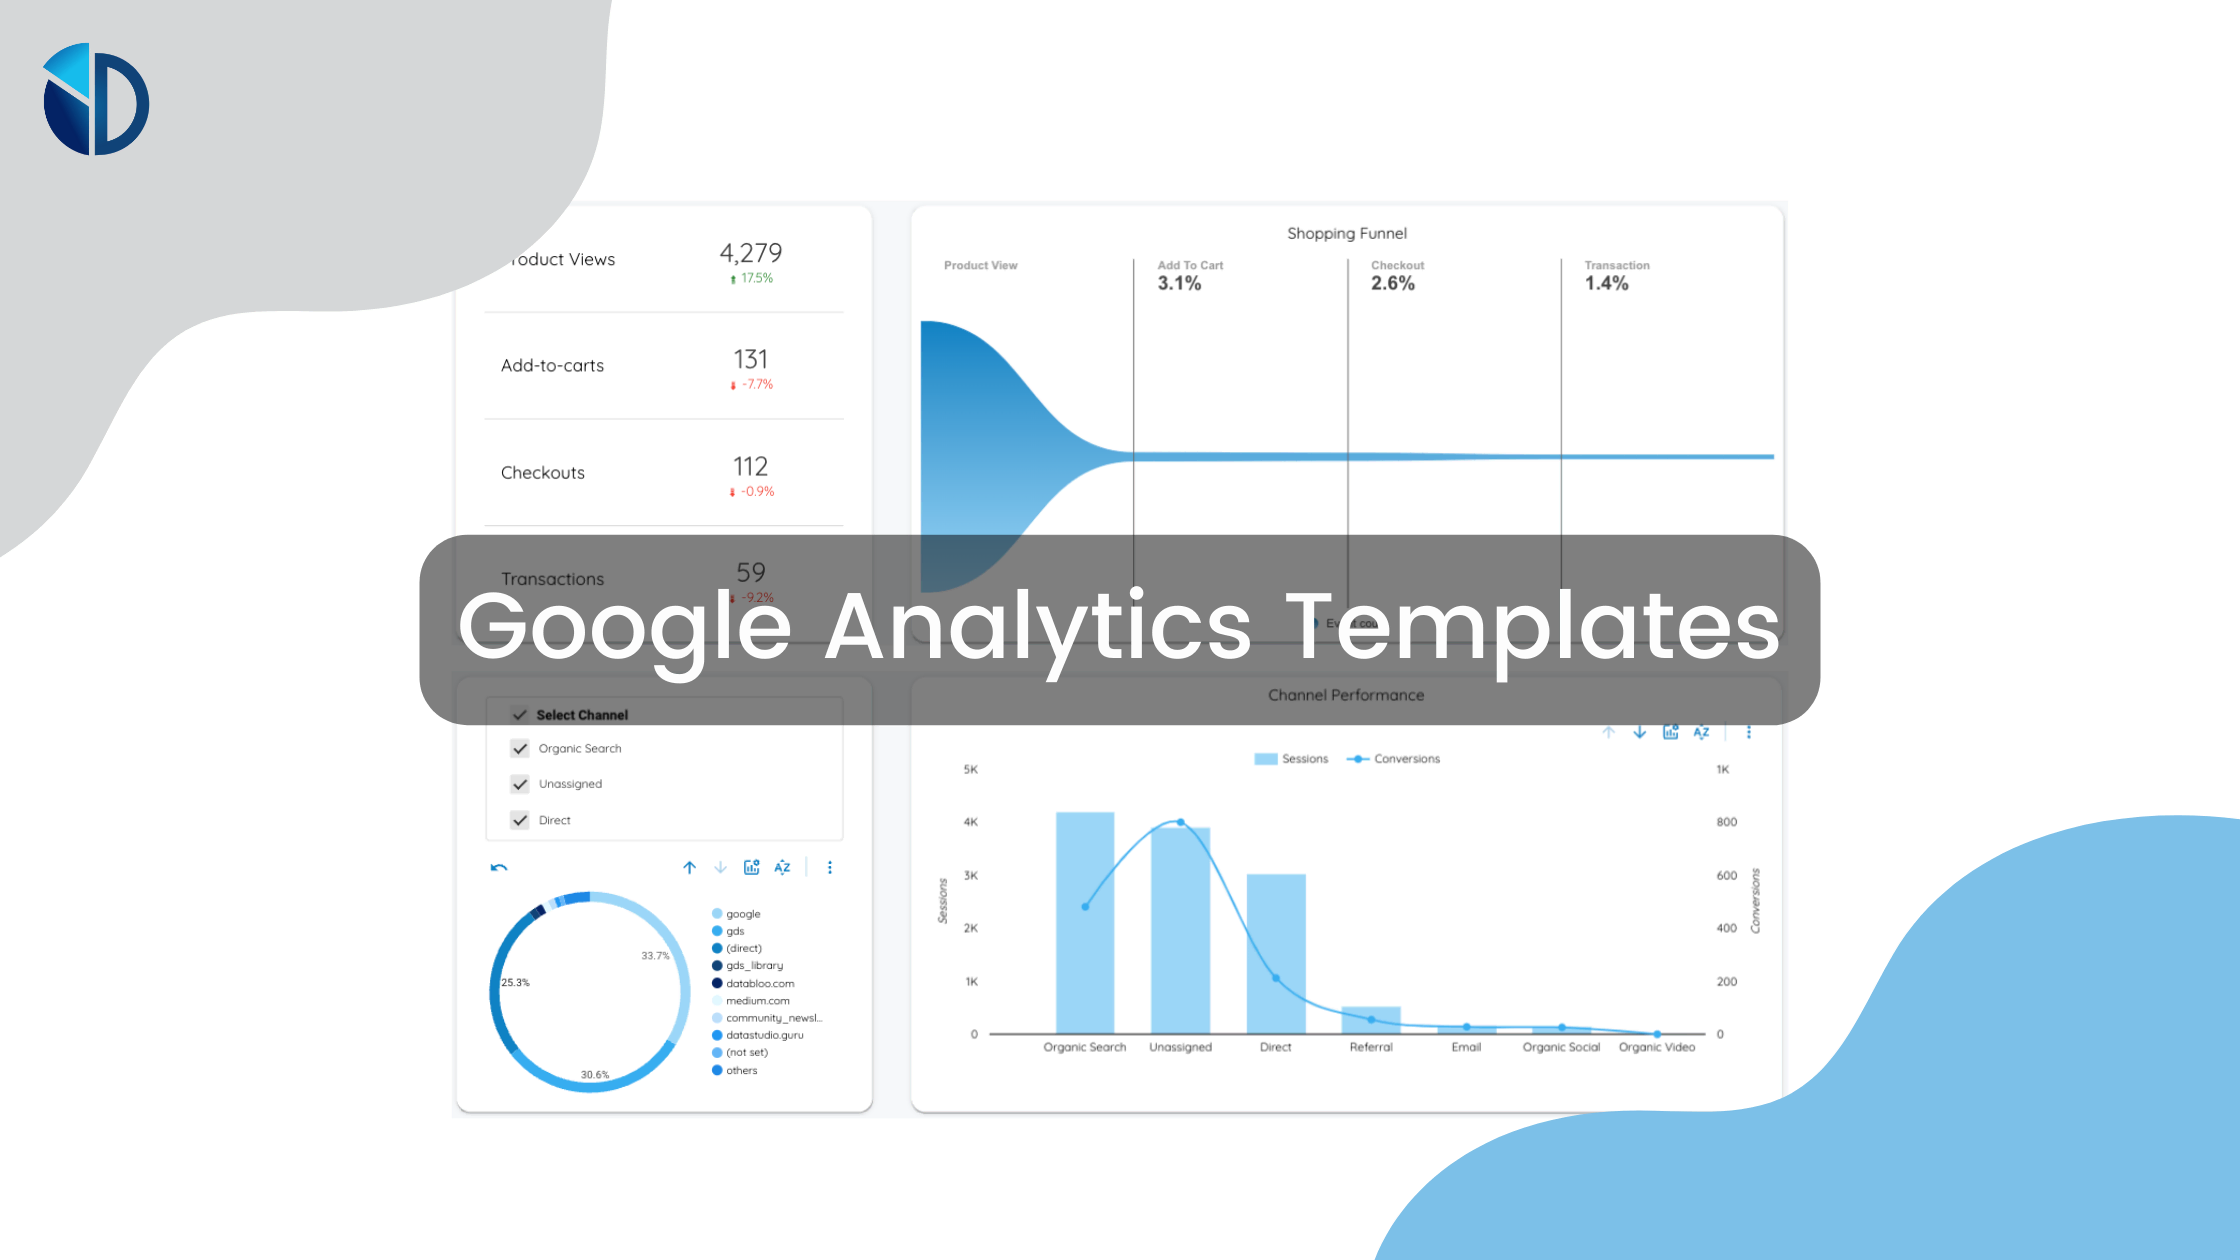
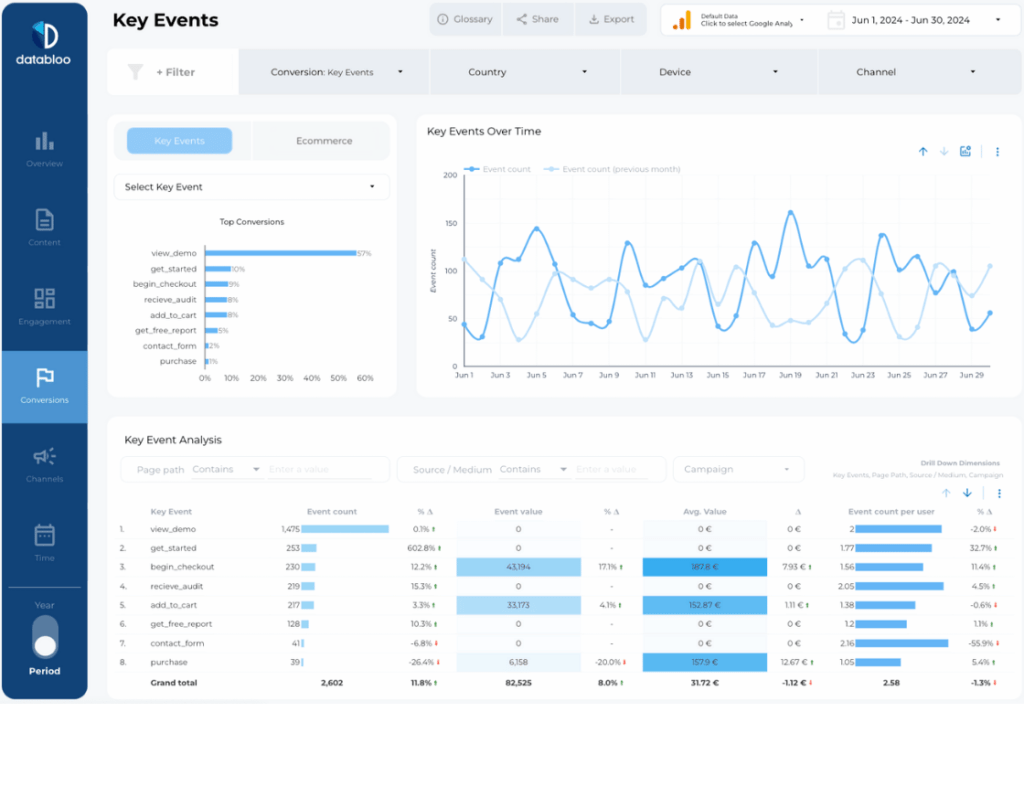
The GA4 Looker Studio template connects directly to Google Analytics 4 to provide you with the latest data in real time. This allows you to monitor users, interactions, engagement, and purchase activity from a single place.
This template is perfect to find out how your users are trending over time. You can also monitor website content to see what content drives more engagement than others. On top of that, you can track the most important user interactions (conversions) and e-commerce trends on your online store. In this way, you can optimize your website to be even more effective.
2. GA4 Conversion Funnel Looker Studio Template
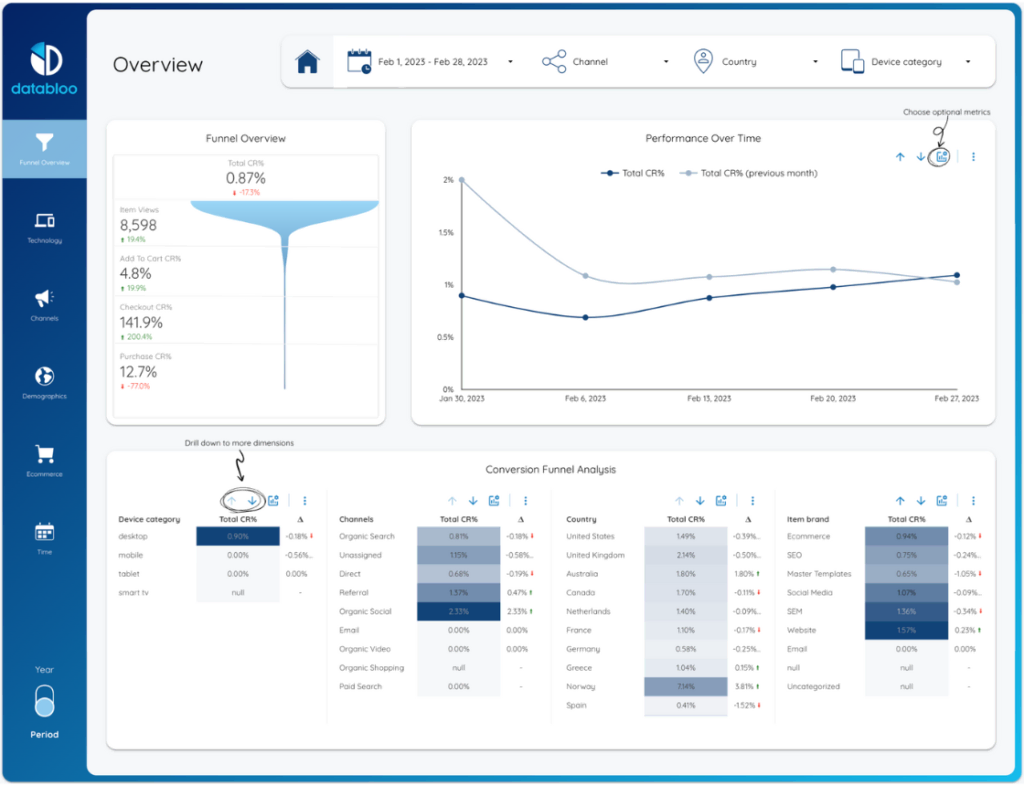
The Conversion Funnel template is designed perfectly for e-commerce businesses. This is because the template comes with everything you need to monitor your entire business funnel. The template also lets you know what devices visitors are using and how they react to each product.
Having the ability to monitor your users’ behavior allows you to make adjustments to your website. This can be content changes or design changes to help keep users engaged until they finally make a purchase.
3. GA4 Ecommerce Revenue Looker Studio Template
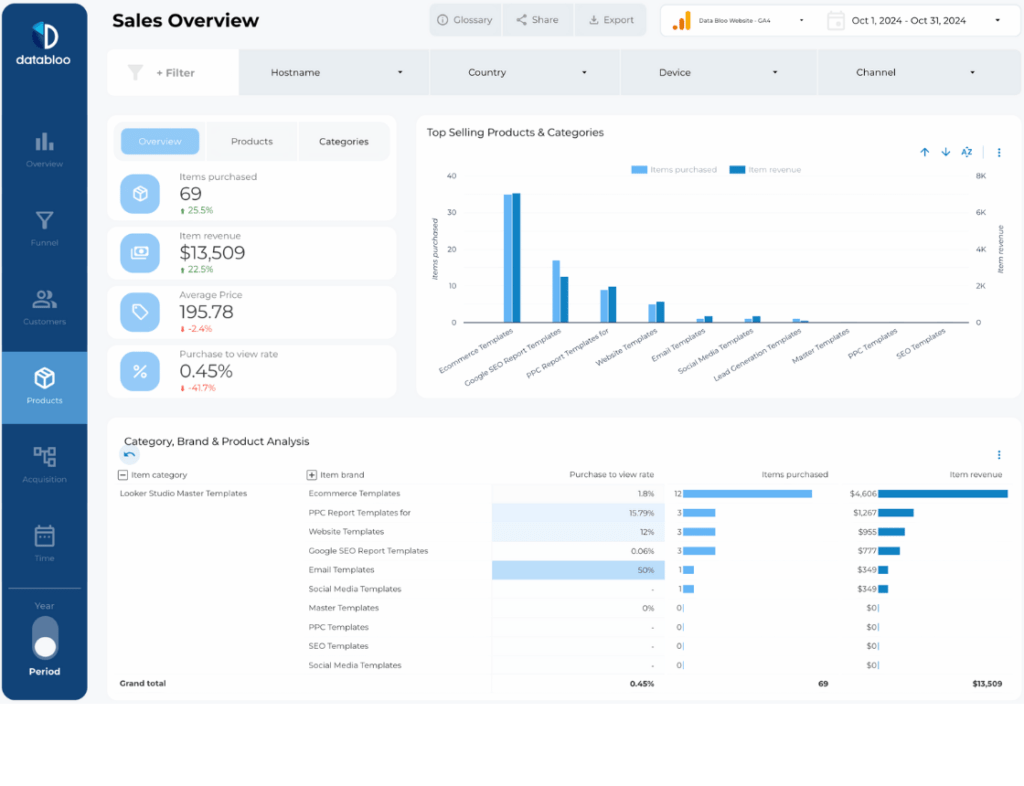
If you’re an online store or have an online store as part of your website, the Ecommerce Revenue template is designed for you. This template highlights all the necessary KPIs so that you can track your e-commerce activity. The data that you get from this template includes sales, revenue, buyers, and the overall conversion rate for your website. Essential information like your best-selling product will allow you to guide your marketing campaign accordingly.
4. GA4 Content Performance Looker Studio Template
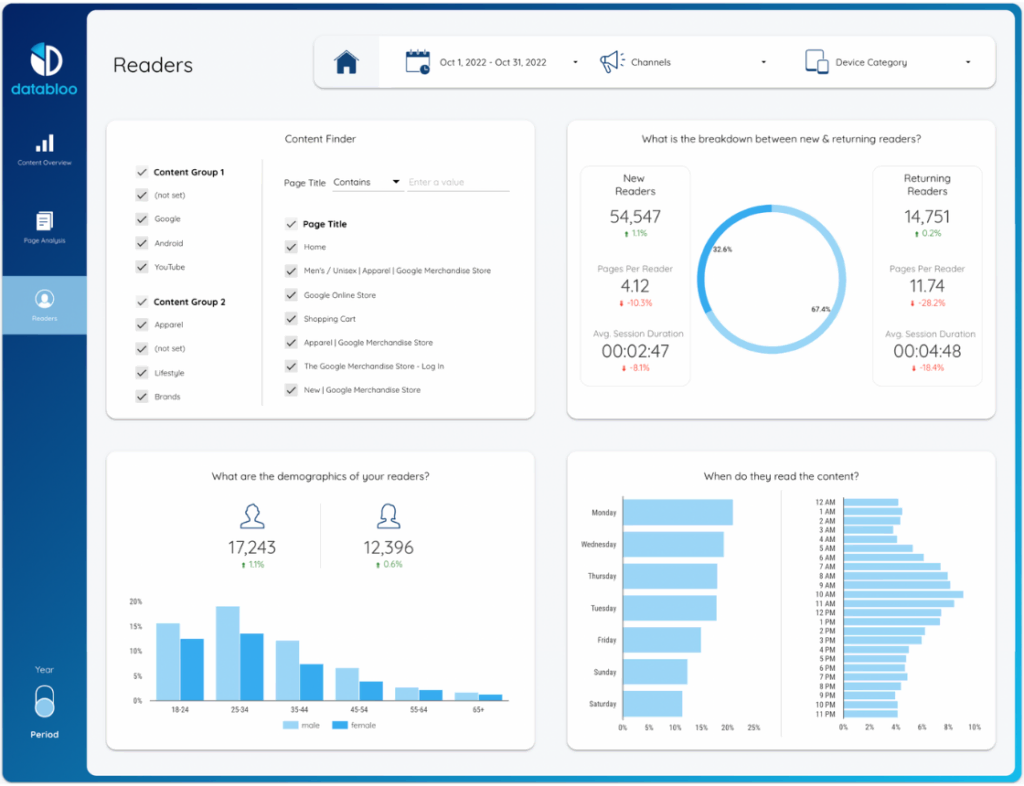
The Content Performance template is ideal for businesses that use content marketing to engage with their audience. This template comes with a content overview, page analysis, and an in-depth guide on your website’s readers. The high-level overview allows you to quickly spot your best-performing content along with the pages that need more work.
Data is taken directly from Google Analytics and presented in the dashboard in real time. What makes this template so effective is that it presents page data as a summary that can be broken down further if you want. In this way, you’ll be able to spot improvements easily.
Creating The Best Web Analytics Reporting Template
Having a business website is essential in the modern economy. While it’s important to optimize your website for consumer performance, keeping an eye on your website data is just as important. This is because website data can help you find out where you can improve your business website to grow your business.
When it comes to analyzing your website data, analytics templates make your life easier. These templates allow you to see all the information you need in a simple, elegant dashboard. Contact us today for custom templates that can help you optimize your website.

