Table of Contents
Do you have a large quantity of data but don’t know how to visualize it? That’s where Google Data Studio comes in.
Google Data Studio is an excellent tool to help you present and analyze your data. Although it’s easy to use, it can be a little challenging for beginners. Even if you have been using it for some time, you might still need help with some features.
We have created a guide to help you in this regard. In this tutorial, you will learn everything from building reports and customizations to bringing your data to life.
Over the course of several chapters, we will show you how to use Google Data Studio to assess your data and use all of its amazing features. This might seem hard at first, but learning to use Google Data Studio is definitely worth the time.
What is Google Data Studio?
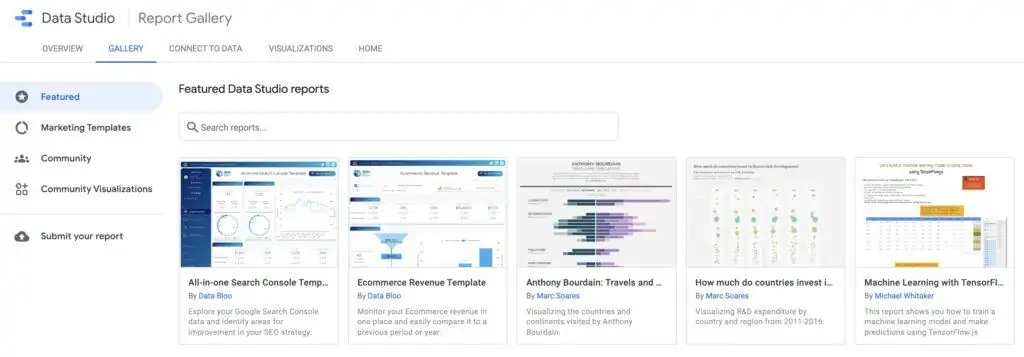
This free cloud-based tool is designed to help you make centralized reports from data. If you have collected data from websites, applications, ecommerce stores, or from digital marketing, you can now use Google Data Studio to assess it.
With this tool, you can create graphically pleasing reports and collect large amounts of data into a single presentation. You can then share your collected data as a presentation in a pdf format or a report link (shareable short URL for the report) and impress everyone with your figures.
4 Goals of Google Data Studio
There are four major goals that Google Data Studio can help you accomplish:
- Visualize your data quickly
- Create one presentation from all of your data aiming to improve your decision making
- Save reporting hours from you and your team (from manual excel sheets)
- Share presentations with your internal and external stakeholders
Apart from these, once you learn how to use Google Data Studio, there is a lot more you can do. With large amounts of data, you need a tool that can help you make sense of it. Google Data Studio is a lifesaver for data analysts.
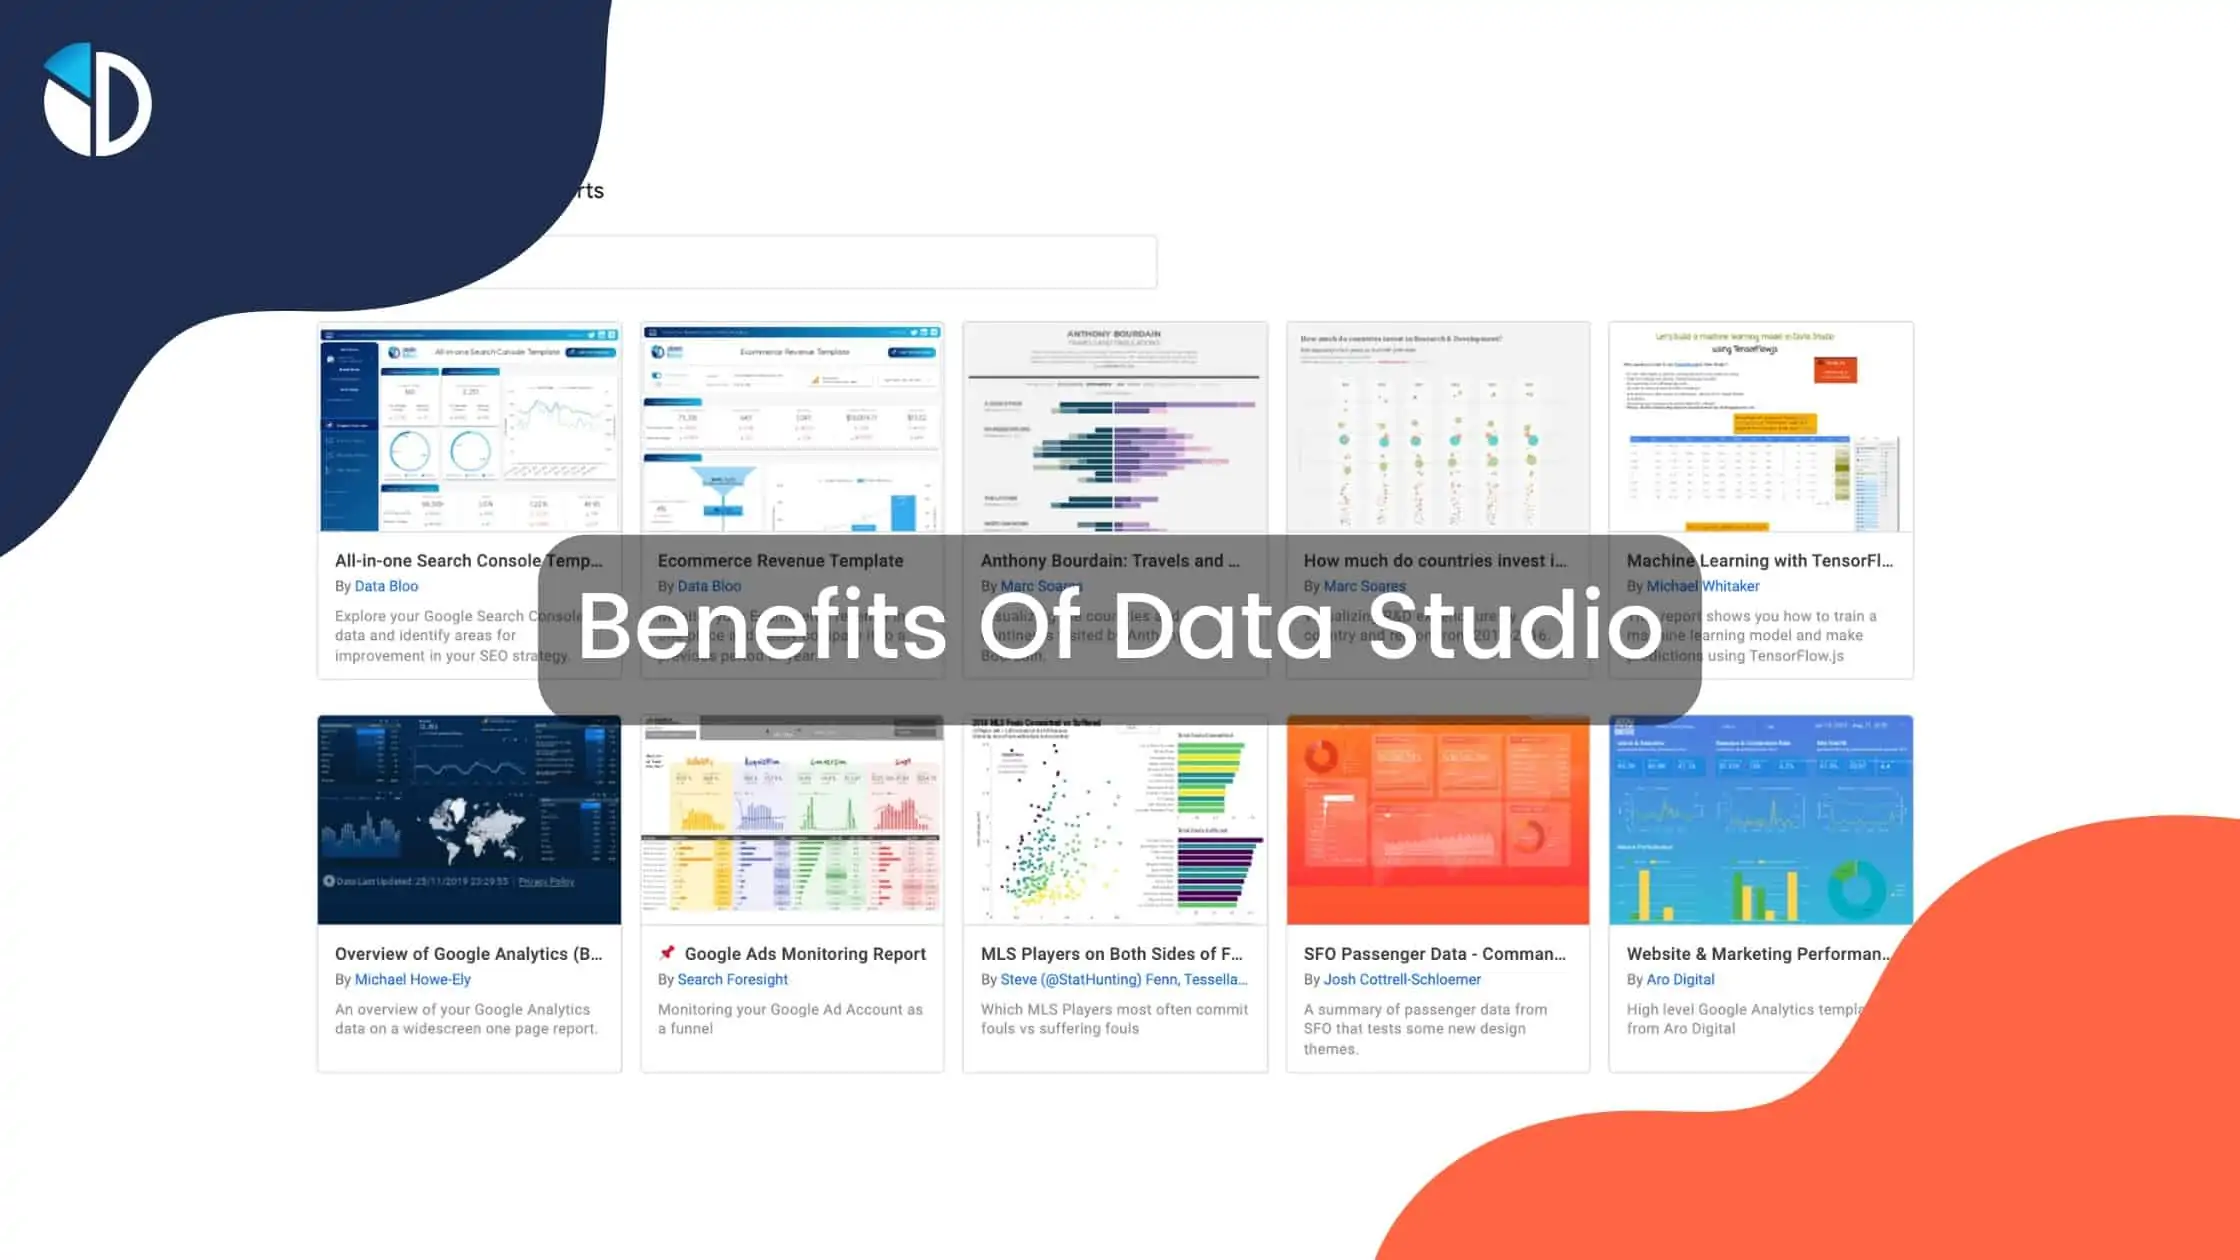
What are the benefits of using Google Data Studio?
Why use Google Data Studio? That is a good question, and we have listed several reasons why you need to start using it right away.
Free and Easy to Use:
First off, Google Data Studio is completely free of cost. You don’t need to buy a subscription to use it, and this tool can be easily accessed from anywhere. It is also not very hard once you learn how to use it.
Easy Accessibility:
As it is cloud-based, you can access your data from any device. Even for mobiles, there are specific ready-to-use reports that match these screens precisely. You can also easily share report links and presentations with other partners.
Creative Design:
Google Data Studio allows you to present information in a way that’s visually pleasing. Sit back and let your data tell your brand story. You can also customize your data any way you like.
Analyze Data:
Data visualization from Google Data Studio can assist you in data interpretation and retention. You can figure out the trends and changes in your data without spending hours going through lengthy Excel Sheets.
Dynamic:
One of the best features of Google Data Studio is, you can make and edit reports in real-time. As soon as new data is added, you can visualize and analyze it.
Share Data:
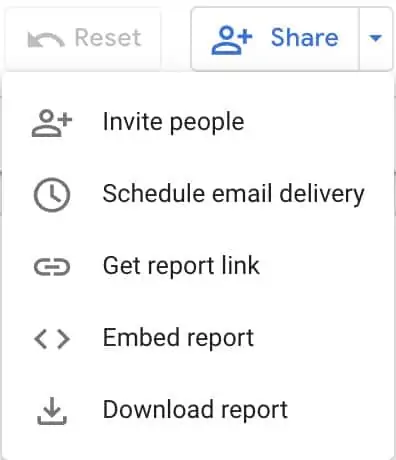
If you have a large team working on your department/business/project, you can share your reports with them in different formats with Google Data Studio. The available options for sharing the Data Studio reports are unique URL links, embedded reports, downloadable PDFs, and automatic email deliveries.
With all these amazing features, Google Data Studio can make data interpretation much easier for you. With our guide, you will learn how to use Google Data Studio to visualize your data.
Now that you have gained some insight into how Google Data Studio works, let’s take a look at who can benefit from Google Data Studio.

