Combining Multiple Channels
With this Multi-channel report, you can evaluate the performance of your digital marketing efforts and easily answer questions like:
Website
How long are site visitors staying on my website?
Which pages do website visitors engage with the most?
What are the demographics of my website visitors?
How has my ecommerce data changed over a period of time?
Have my conversion rates improved or declined?
SEO
How well have my organic search strategies performed?
Which keywords are performing better? Branded or generic? Which keyword and keyword phrases are bringing the most organic traffic?
What is the performance of my SEO strategy on each type of device?
How has my search traffic performance changed over a set period of time?
SEM
How well is my current Google Ads campaign performing?
Are my current campaigns achieving my target conversions?
What is the current conversion rate of my Google Ads campaign?
Which keywords are getting the most conversions?
How much is the cost & ROAS of my active campaigns?
Social Media Ads
How many purchases am I reaching within a given time period?
What is my conversion rate?
How much am I spending on my Facebook Ads campaigns?
How many link clicks am I reaching in my latest campaign?
Which countries am I selling the most?
Which of my recent campaigns performed the best? Which one performed the least?
Read More
Combining Multiple Data Sources
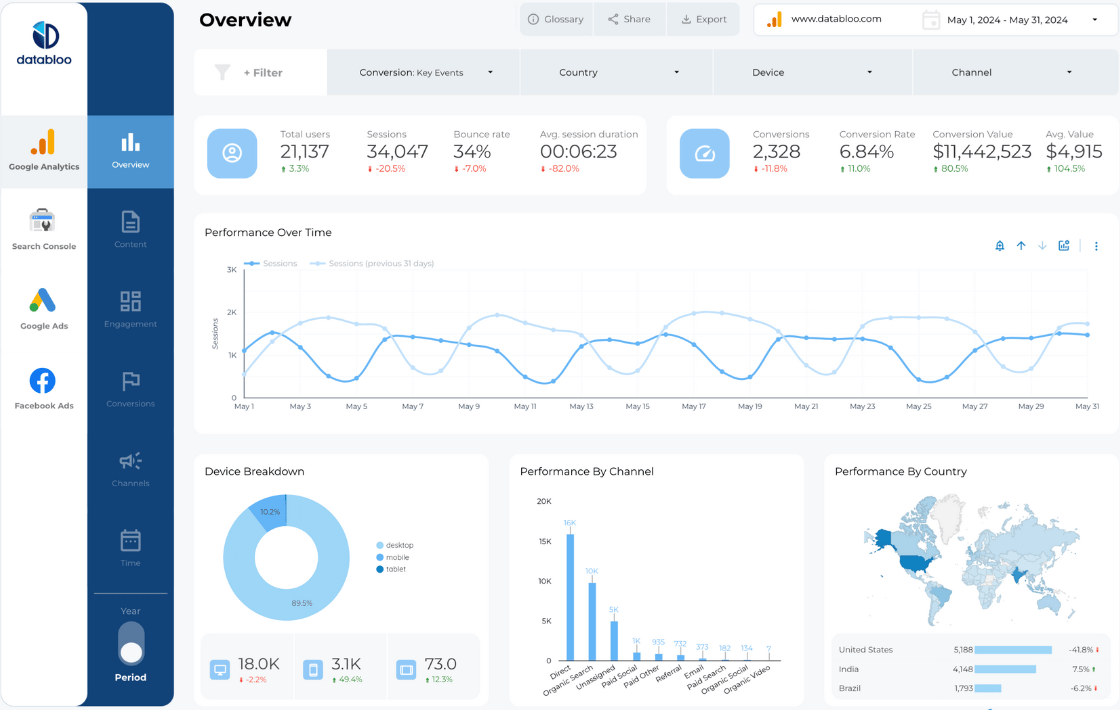
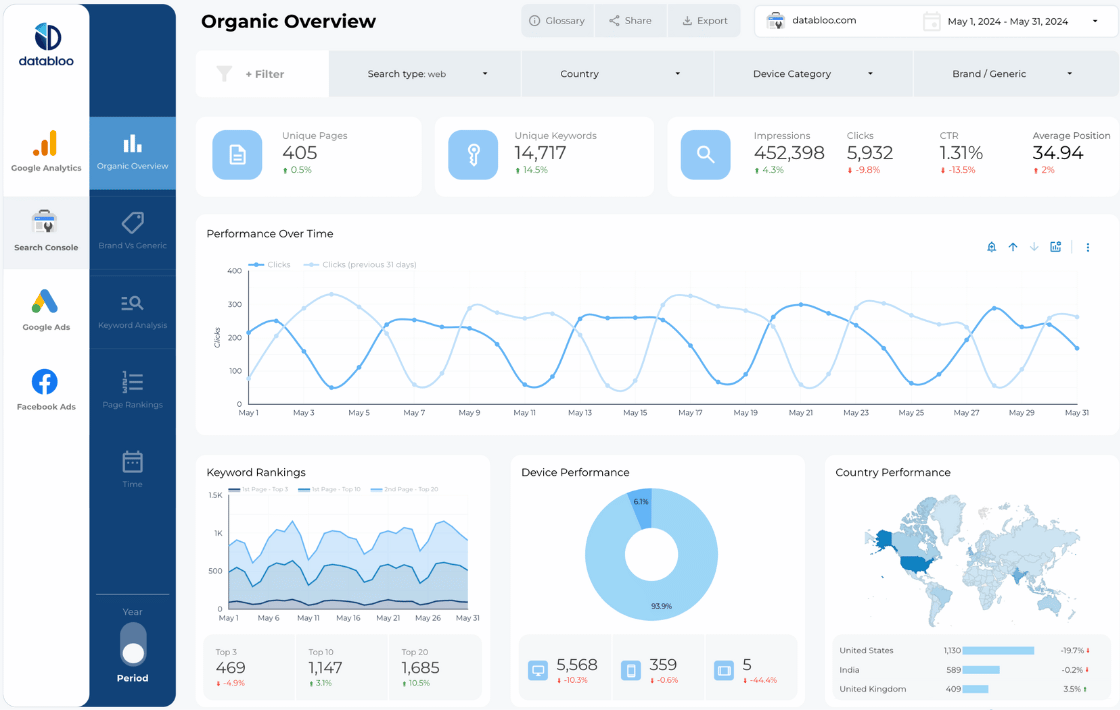
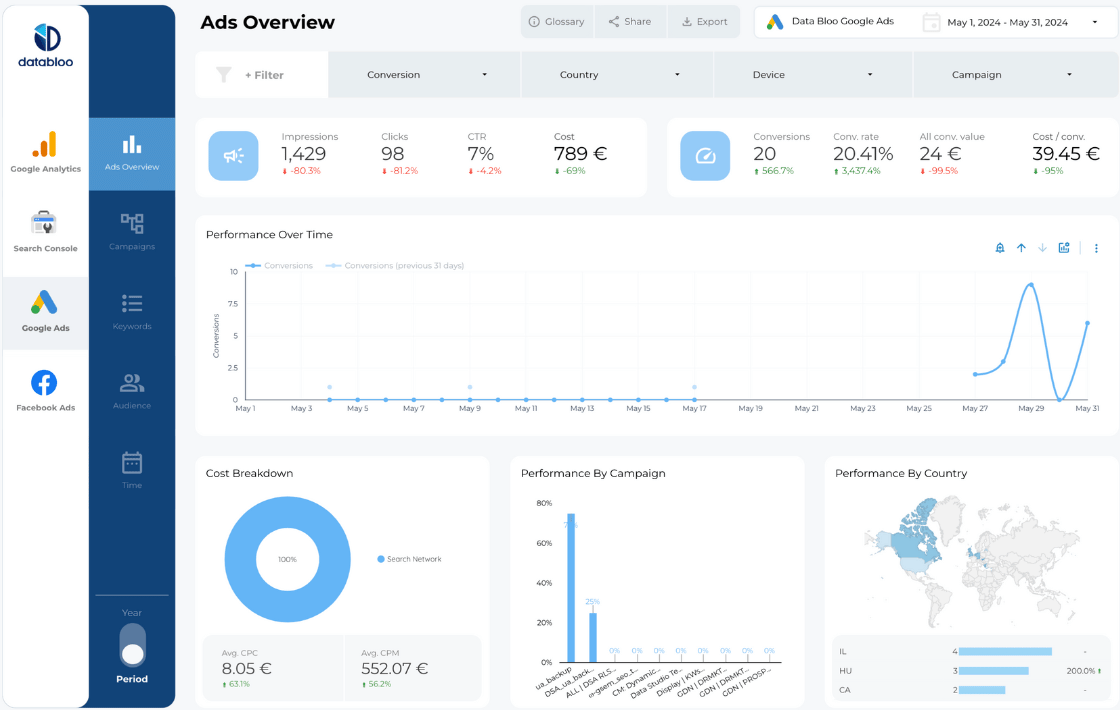
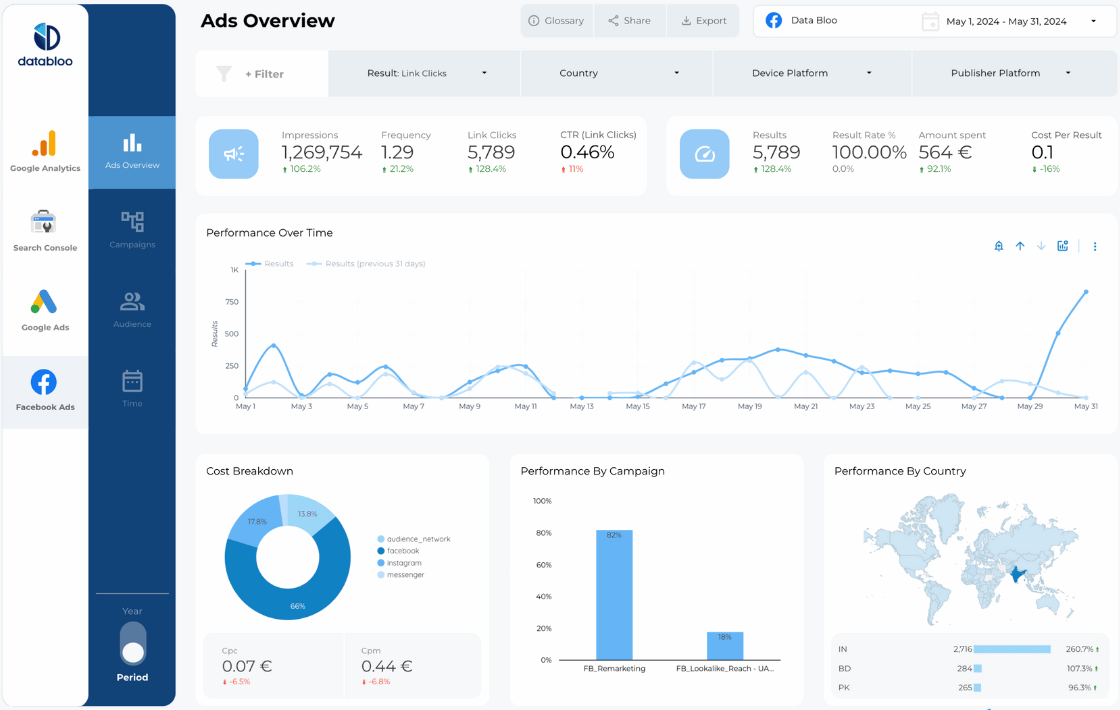
The Digital Performance Master Template consolidates data from four different sources: Google Analytics, Google Ads, Google Search Console, and Facebook Ads. These are separated into four sections that you can easily navigate through the menu of this report.
Google Analytics
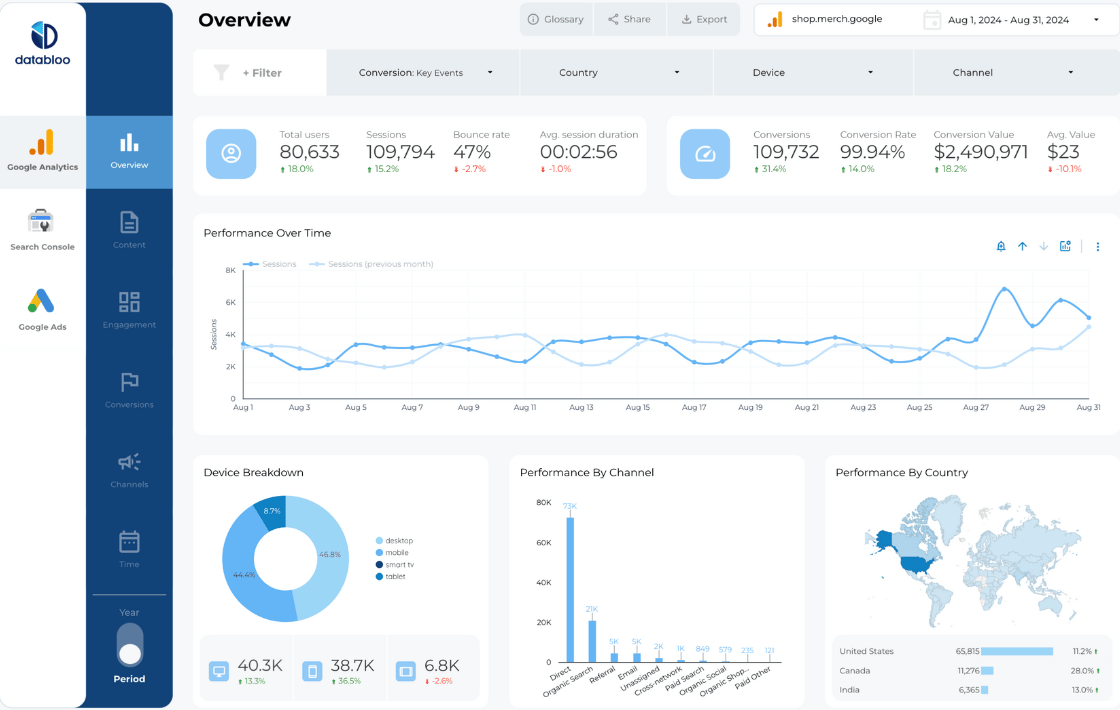
The first section includes data from your Google Analytics property that helps you gain various insights about your website traffic. It contains information like the session length of each visit, the user interactions with your content and top-visited pages, your conversion rates, and the activity of your customers. That way, you’ll know your website’s strengths and what can be improved upon.
Google Ads
Using this data you can easily monitor your Google Ad campaigns. This section provides insight into your conversion rates, number of impressions and clicks, and the overall performance of a campaign in a set period. Additionally, it breaks down the performance in a keyword, demographics, and competition level.
Google Search Console
The Google Search Console pages provide data about your SEO efforts. Here, you can see which keywords are performing well, your average position on search engine results pages, your search traffic, and even your performance in various countries. Furthermore, it drills downs the organic search traffic based on brand & generic keywords and the keyword ranking (top 3, Top 10, etc.).
Facebook Ads
The last part of this report includes the Facebook Ads reporting. This allows you to see the performance of your social media ad campaigns on Facebook, Instagram, Messenger, and other affiliated platforms. Get insights about your link clicks, impressions, purchases, and the overall performance of your campaigns.
Step-By-Step Instructions
We’ve designed two different versions of the Digital Performance Master Template, one for Universal Analytics and one for GA4 (including Extract Data source to tackle the quota issues). For both versions, you can use our easy-to-understand instructions to make your own copy and then customize it based on your needs.
No Subscription Fees for Facebook Ads Connector
The Digital Performance Master Template uses a free connection type in order to pull the Facebook Ads data to Looker Studio. This option is via a direct Looker Studio connector and you don’t need to pay additional fees to get the insights you need.


