Table of Contents
A web analytics dashboard will help you understand user behavior, report on website performance, and optimize digital strategies.
It provides insights into traffic sources, page views, user engagement, conversions, and audience insights that facilitate and support data-driven decisions for driving digital growth and optimizing your digital marketing strategies.
What KPIs Web Analytics Dashboard Should Include
Below are the most efficient and useful metrics that are present in the web analytics dashboard with examples on how to use and interpret them.
Sessions
Sessions are a key metric in web analytics dashboards, as they provide essential insights into user engagement and website performance. Variations in daily or monthly session counts can have a significant impact on a business’s revenue.
However, merely viewing session numbers in isolation is not sufficient. A more effective approach is to track session trends over time. This helps in identifying short-term successes and comparing current performance with past periods, such as comparing this month’s sessions with last month’s.
Such analysis is crucial for a comprehensive evaluation of your web analytics strategy.
Incorporating sessions into your web analytics dashboard becomes even more powerful when combined with these metrics:
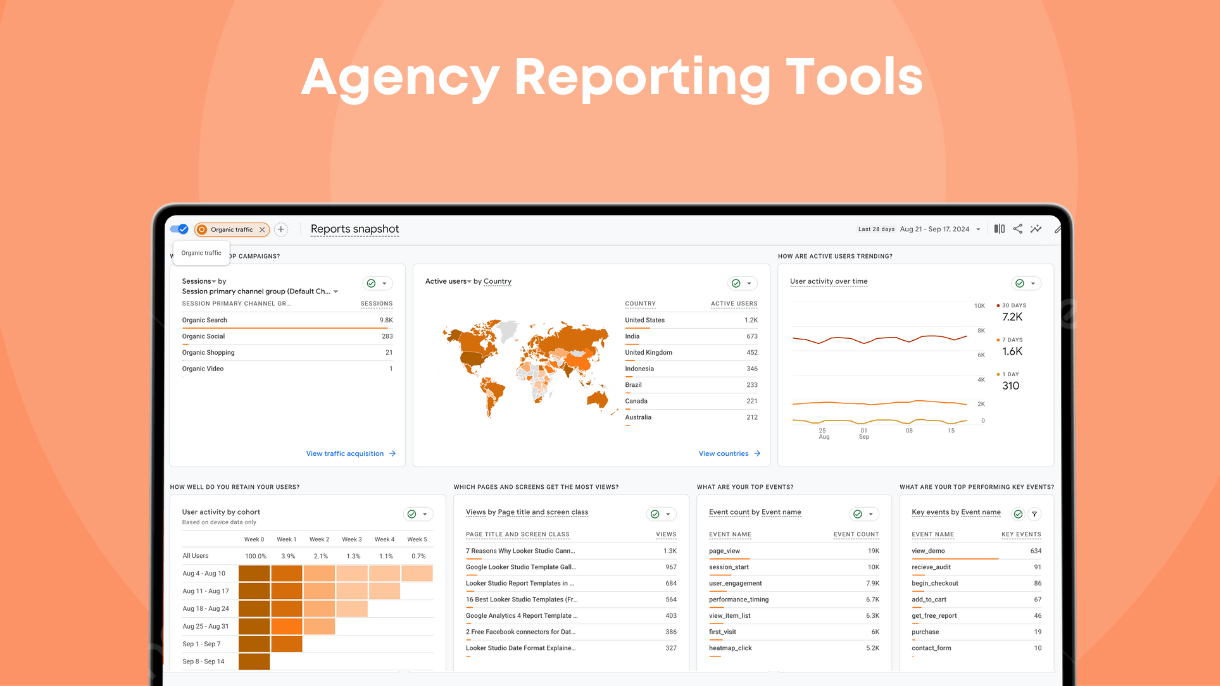
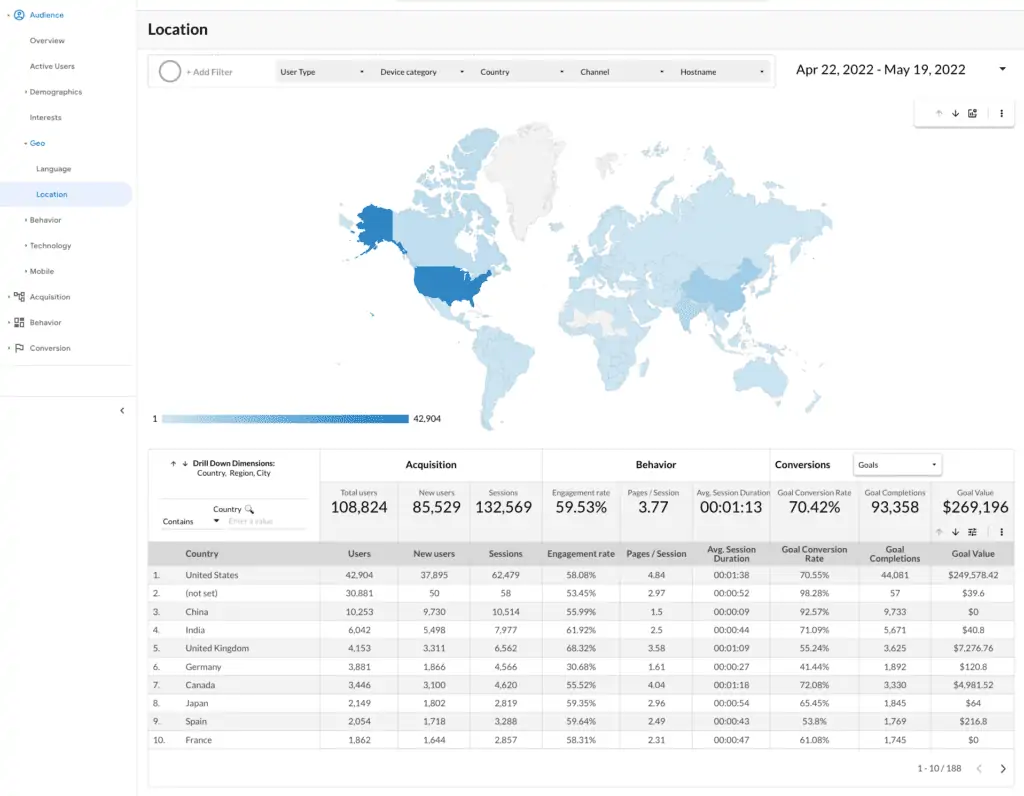
Sessions by Source. This metric allows for a quick identification of the reasons behind changes in session numbers. Having both sessions and their sources in the same report enables efficient determination of what is influencing these changes.
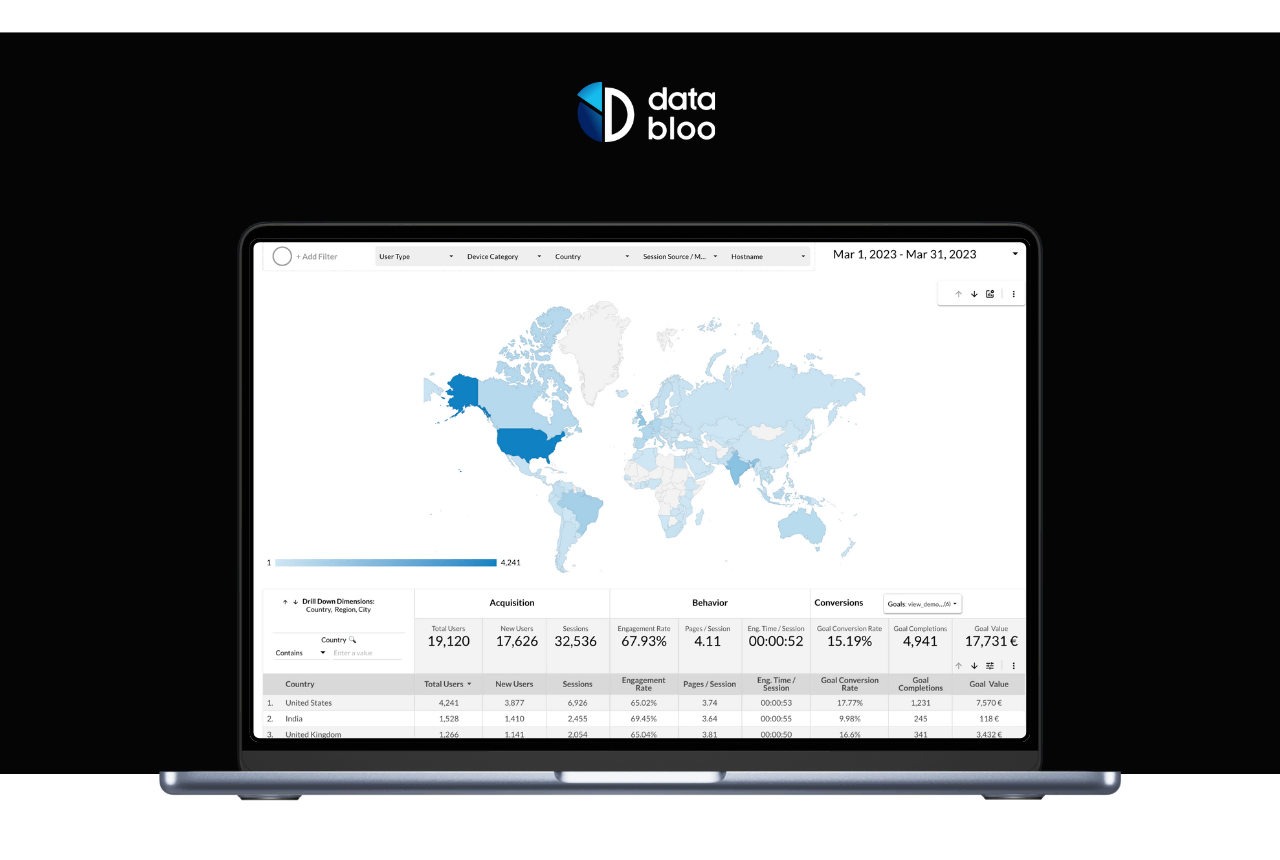
Sessions by Country. This metric is vital for detecting fluctuations in sessions from specific countries. It’s an important tool for assessing your reach in targeted geographical areas.
Sessions by Device. For example, a notable decrease in sessions from mobile users can signal the need to review the mobile optimization of your web pages. Monitoring sessions by device type ensures your content is effectively reaching users on their preferred devices.
Content Performance
Monitoring content performance in detail is essential and is the cornerstone of any content marketing strategy.
It’s important to identify which pages are performing best by tracking views, user interactions, and the success of different content categories.
Pro tip: With this web analytics dashboard template, you can segment data to focus on the performance of distinct content categories using keyword or regex filters.
Key metrics for analyzing content performance in web analytics include:
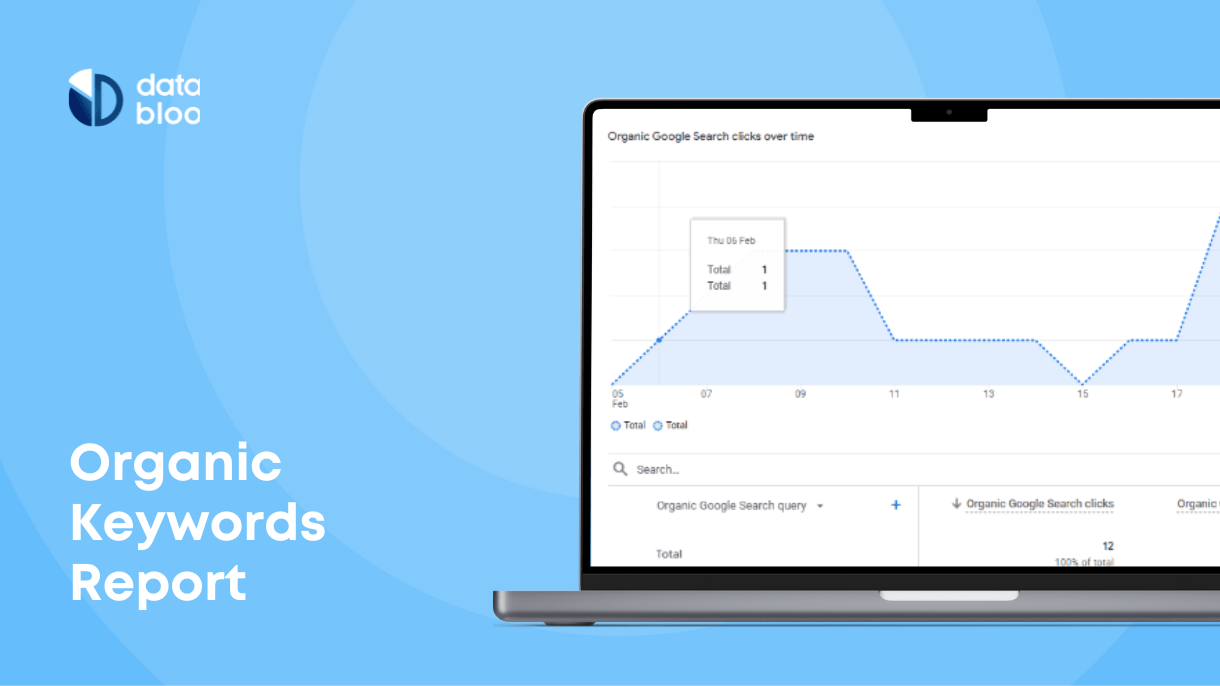
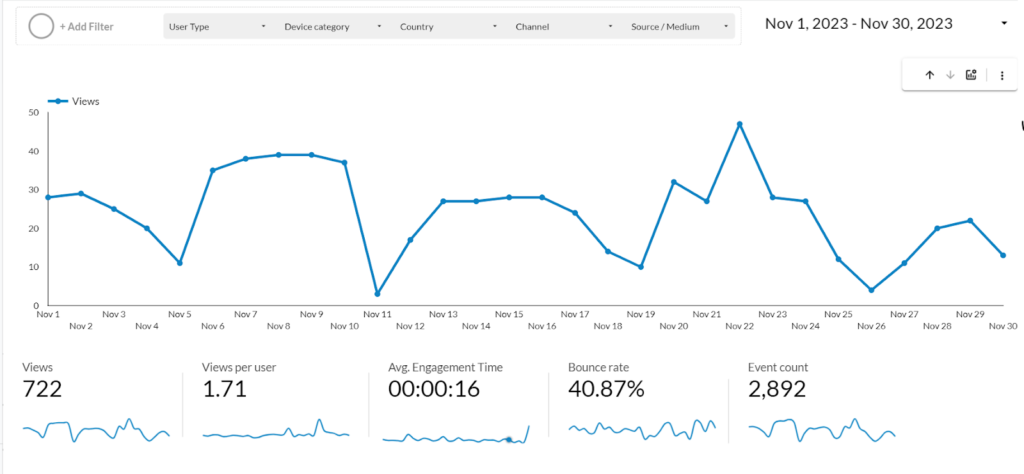
Content Views Over Time. This metric measures the number of times your content is viewed, offering insights into its popularity and relevance during specific time frames.
Event Count. This goes beyond simple view counts, examining how each content piece drives specific user actions, such as clicks, cart additions, or form initiations. This metric is crucial for understanding how your content directly influences user engagement and conversion rates.
Conversions
Conversions are where your website traffic meets business goals.
By setting up desired conversion actions (such as adding items to the cart, signing up for a newsletter, or downloading a PDF guide), you can accurately monitor how your website pages contribute to business bottom line.
Establishing these conversion goals is essential for quantifying the success of specific user interactions, like engaging with a demo product or adding items to a shopping cart.
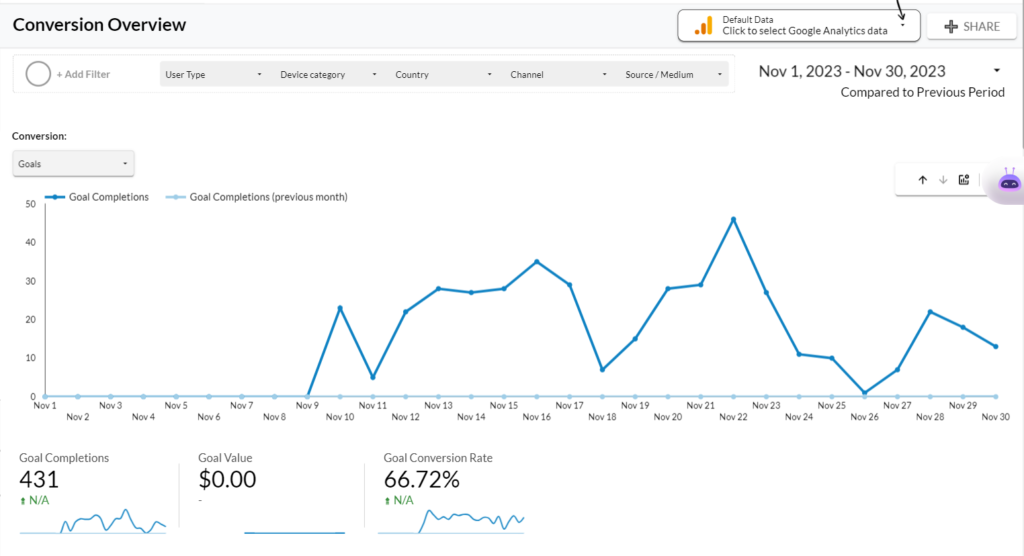
Monitoring conversions over time is crucial for promptly responding to shifts in customer behavior.
In a comprehensive web analytics report, having content and session data just a tab away facilitates quick analysis of the most and least effective conversion channels.
Having access to conversion data from various channels in proximity is beneficial for comparing the effectiveness of different web analytics strategies. It is recommended to have a separate report for other marketing channels, which can be easily accessed and will be discussed in the subsequent section.
Web Analytics Report and Other Marketing Channels Relation
Web analytics reports often overlook the vital aspect of correlating with other marketing channels.
Understanding these relationships can trigger a cycle of growth in your marketing department. Identifying a successful channel enables you to adapt its successful strategies to other channels, creating a cycle of continuous improvement and advancement.
To assess the effectiveness of your web analytics strategies in relation to other marketing initiatives, it’s crucial to compare conversion metrics and other key performance indicators.
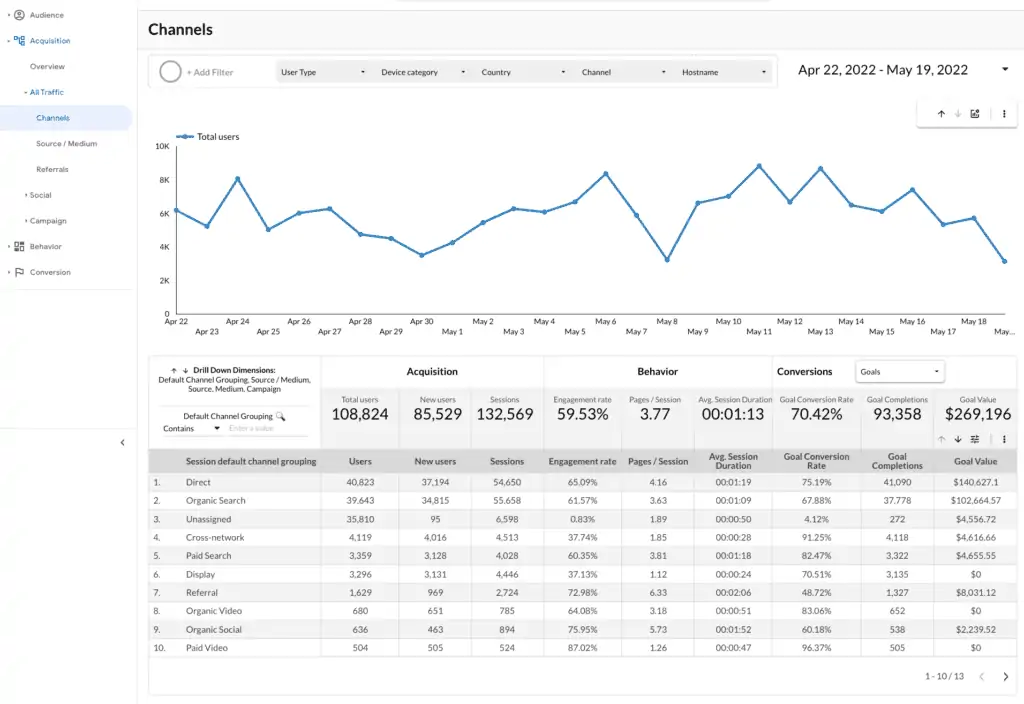
This comparison will help you answer these essential questions:
- How does the performance of our web analytics strategy compare to other marketing campaigns we’ve implemented, such as paid advertisement or video marketing?
- Are our web analytics initiatives achieving better (or worse) conversion rates compared to our other marketing channels?
- Is there a need to refine our web analytics strategies, or should we focus on enhancing the performance of other channels to be in line with the outcomes achieved through our web analytics efforts?
Ecommerce Metrics
If you sell products now or plan to sell any assets (physical or digital) in the future, ecommerce section will be a worthy addition to any web analytics dashboard.
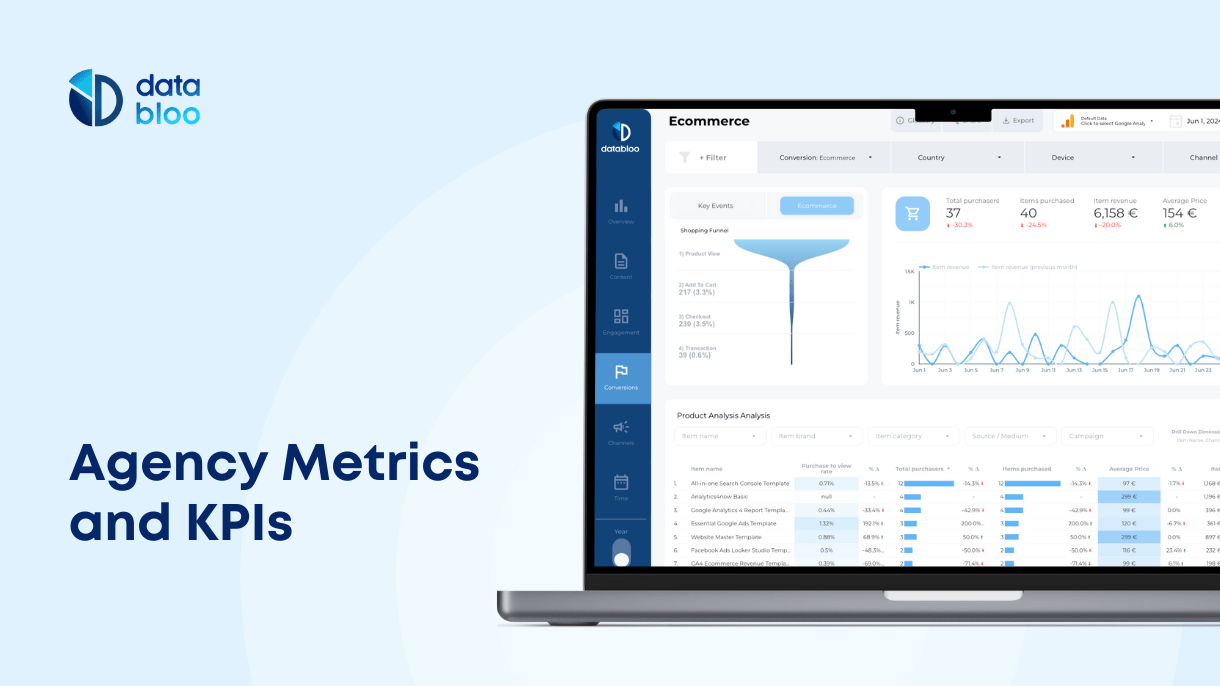
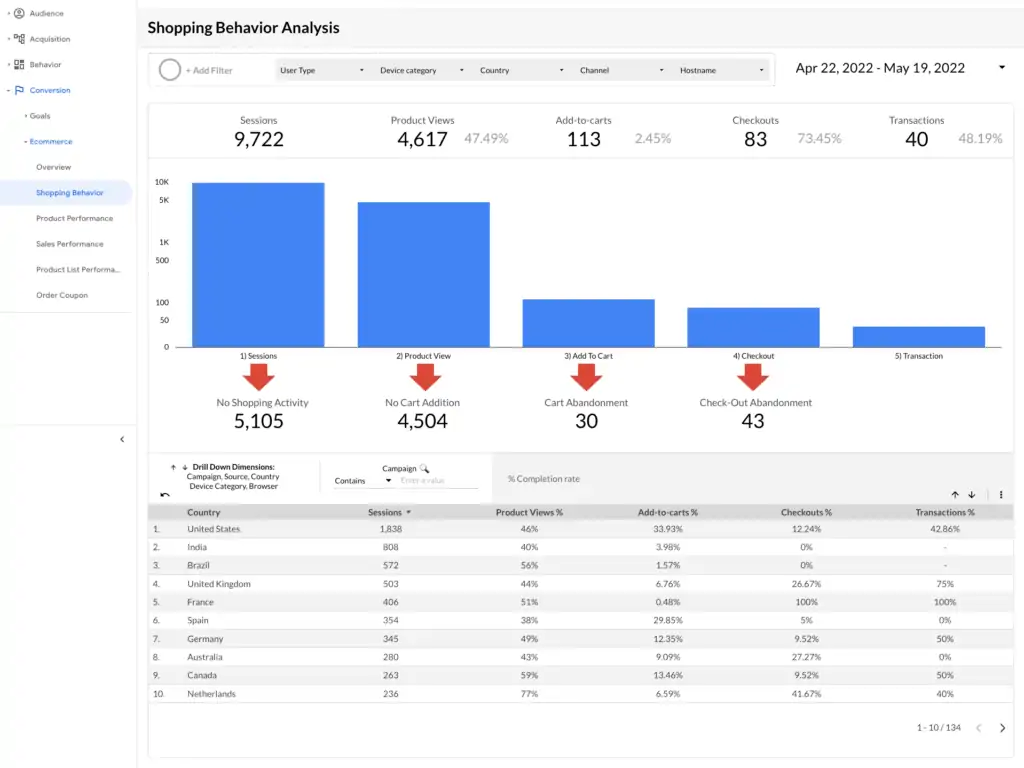
The e-commerce section of a web analytics dashboard offers a comprehensive view of an online store’s performance, providing actionable insights into various aspects of the customer journey. From initial product views to final purchases, this data helps in understanding user behavior and optimizing the sales funnel.
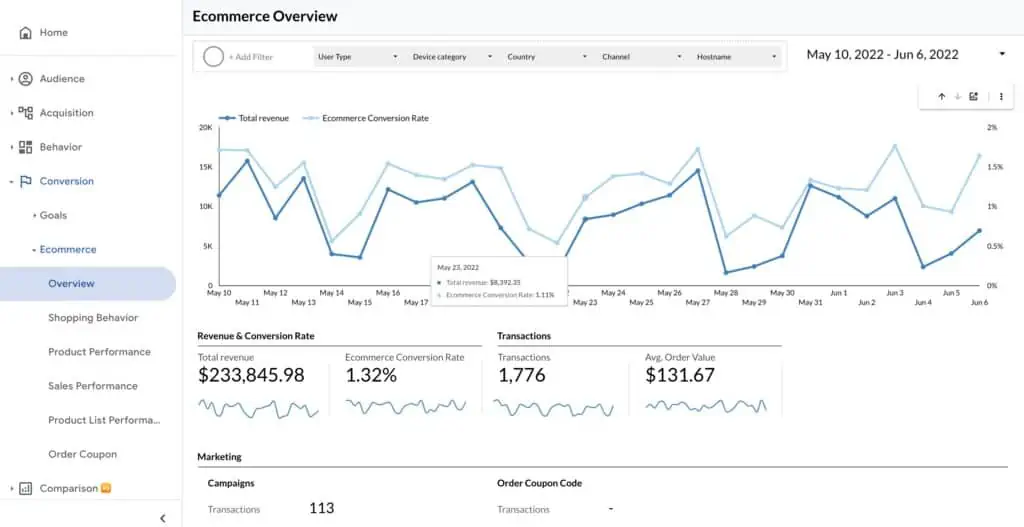
Key metrics presented in this section typically include:
Transactions. The total number of completed purchases within a given timeframe, serving as a direct indicator of sales volume.
Total Revenue. This metric represents the cumulative income generated from all transactions. Tracking revenue over time can highlight trends, seasonality, or the impact of marketing campaigns.
Average Order Value (AOV). By calculating the average spend per transaction, businesses can gauge the value customers find in their products and aim to increase this metric through upselling and cross-selling strategies.
Conversion Rate and Checkout Behavior. The percentage of visits that result in a transaction. A critical efficiency metric, it helps in evaluating the effectiveness of your conversion funnel and the purchasing process.
How to Set Up Web Analytics Dashboard
You can setup a Web Analytics Dashboard in 4 steps using Looker Studio API. It allows you to easily generate your own report in less than a minute with just a few clicks, saving you valuable time and streamlining the configuration process. Here are the four steps:
- Go to the admin panel of your GA4 property and find your account and property IDs. Then open the report url.
- Copy and paste your GA4 Account ID and GA4 Property ID in the respective fields. Click “Get Your Report” to generate your new report.
- Click “Edit and share” at the top right and then “Acknowledge and save” in the new modal window. Wait for a few seconds for the report to be fully generated.
- Allow community visualization access and change the data credential of your data source from Viewer’s to Owner’s.