Skip ahead >>
Marketing reports are not just data; they tell a story. Since people are story-driven, a well-crafted marketing report can captivate, inform, and drive strategic decisions effectively.
By presenting data in a compelling narrative, you can highlight key insights, demonstrate progress, and inspire action among stakeholders, making your reports invaluable tools for success.
In this article, we’ll explore how to create the best marketing reports by transforming raw data into compelling stories. You’ll learn about core components of a successful marketing report, common issues with modern marketing reporting, and the best ways to create marketing reports in your niche. Let’s dive in.
5 Core Components of Every Marketing Report
While metrics and KPIs are essential parts of any marketing report, there are other sections that differentiate a comprehensive, actionable report from a mere collection of numbers.
You can write down each component or not, but even thinking about these elements will help you create insightful, focused, and actionable marketing reports, enabling better decision-making and more effective strategies.
- Executive summary
Brief overview of the report’s key findings and insights, providing a snapshot of overall performance.
Example of executive summary:
“Q1 marketing efforts led to a 15% increase in lead generation, with social media campaigns performing above expectations.”
- Goals and objectives section
Defines specific, measurable targets to align marketing efforts with business objectives.
Example of goals objectives:
“Increase website traffic by 25% and improve conversion rates by 10% within the next quarter.”
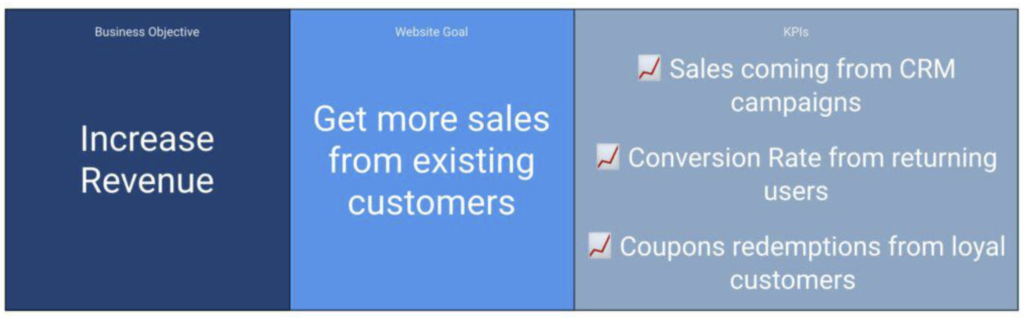
- Metrics and KPIs
Quantitative data points used to measure performance and progress toward goals. Difference between metrics and KPIs: metrics show context, KPIs show progress.
Examples of metrics and KPIs:
- Website Traffic. Total visits, unique visitors
- Conversion Rate. Percentage of visitors who take desired actions
- Engagement. Avg. session duration, total website views, likes, shares, comments on social media posts
- Analysis and Insights
Interpretation of data to identify trends, successes, and areas for improvement.
Example of analysis and insights:
“Organic search traffic increased by 20%, indicating successful SEO strategies. However, email open rates declined, suggesting a need for content optimization.”
- Recommendations or Plan of Action
Actionable steps based on data analysis to improve future marketing efforts.
Example of recommendations:
“Focus on A/B testing email titles to boost open rates and continue investing in SEO to maintain organic traffic growth.”
Common Types of Marketing Reports
There’s no marketing report that fits it all. Depending on your needs or those who you are reporting to, your report will focus on different aspects of your marketing strategy.
Below are examples of specific marketing reports and key points to focus on for each.
SEO Reports
The main goal of SEO reports is to show the effectiveness of SEO strategies, compare SEO performance to other marketing channels, and connect organic traffic to business metrics such as conversions or brand visibility.
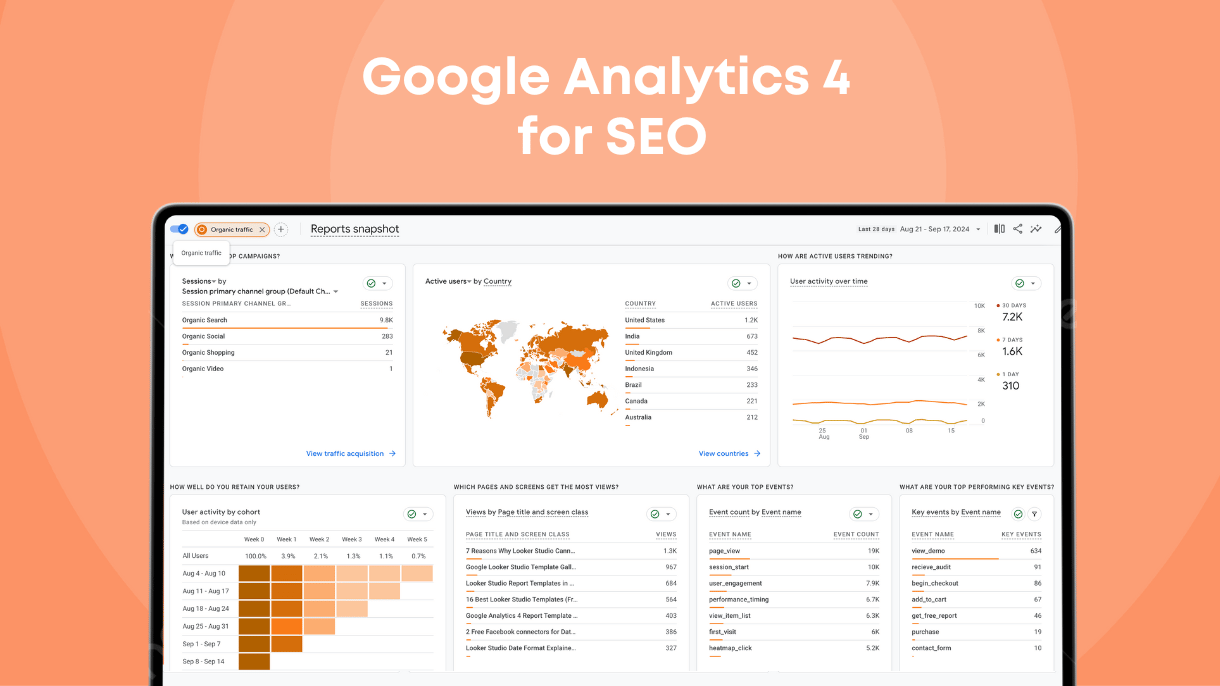
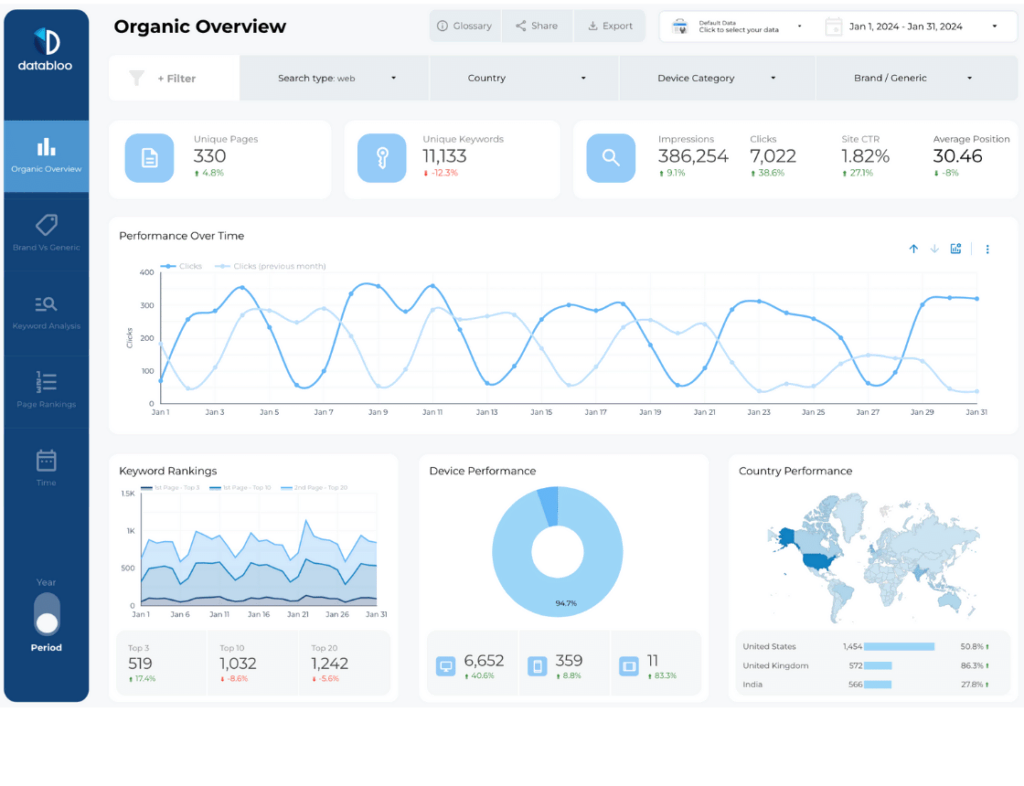
All-around SEO report
Includes an overview of organic traffic, keyword rankings, backlinks, and technical SEO health, providing a comprehensive view of SEO performance.
This report will help answer questions such as:
- How has organic traffic evolved over time?
- What are the current keyword rankings and trends?
- Are there any technical SEO issues impacting performance?
Example of all around SEO Report: Demo your account
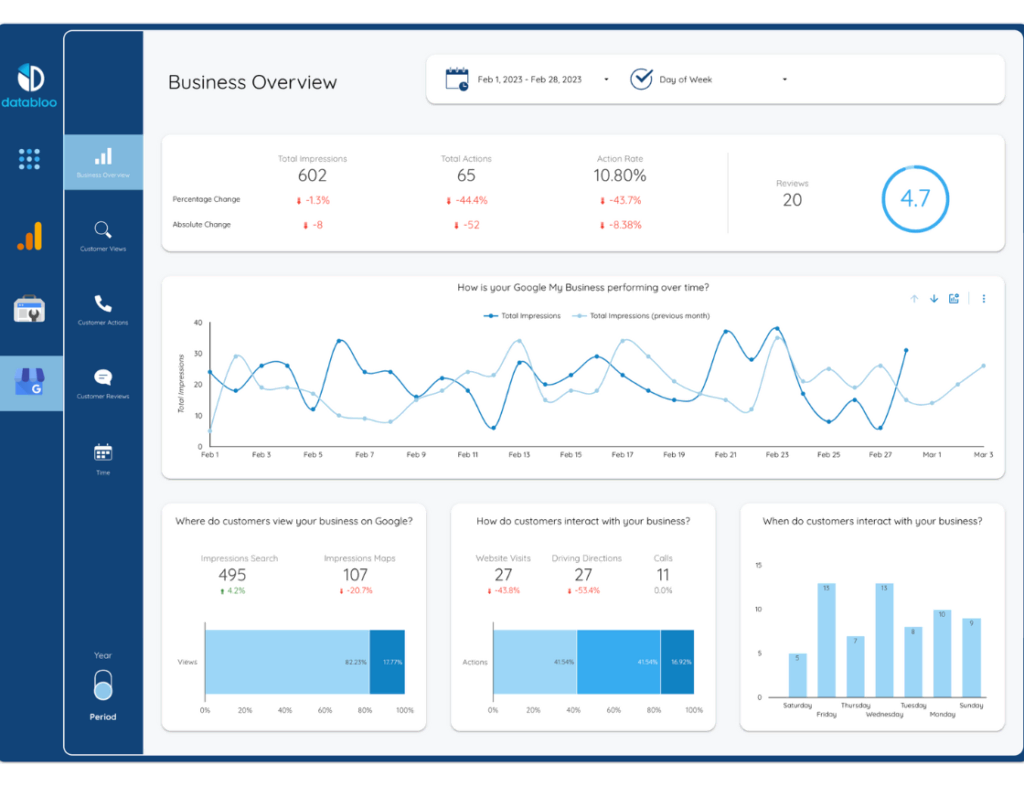
Local SEO report
Focuses on local search performance, tracking local keyword rankings, Google My Business insights, and local citations to improve local visibility.
Local SEO report will help answer questions such as:
- How well is the business ranking for local search terms?
- What is the performance of the Google My Business listing?
- Are there sufficient local citations and reviews?
Example of Local SEO Report: View demo
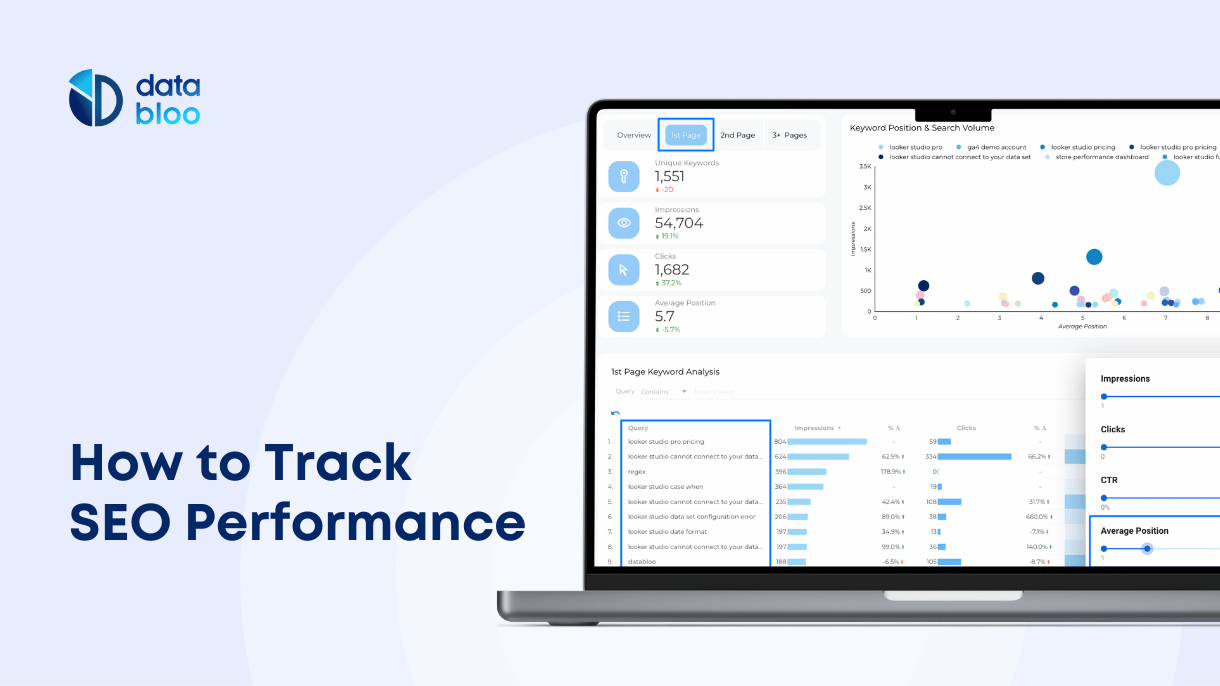
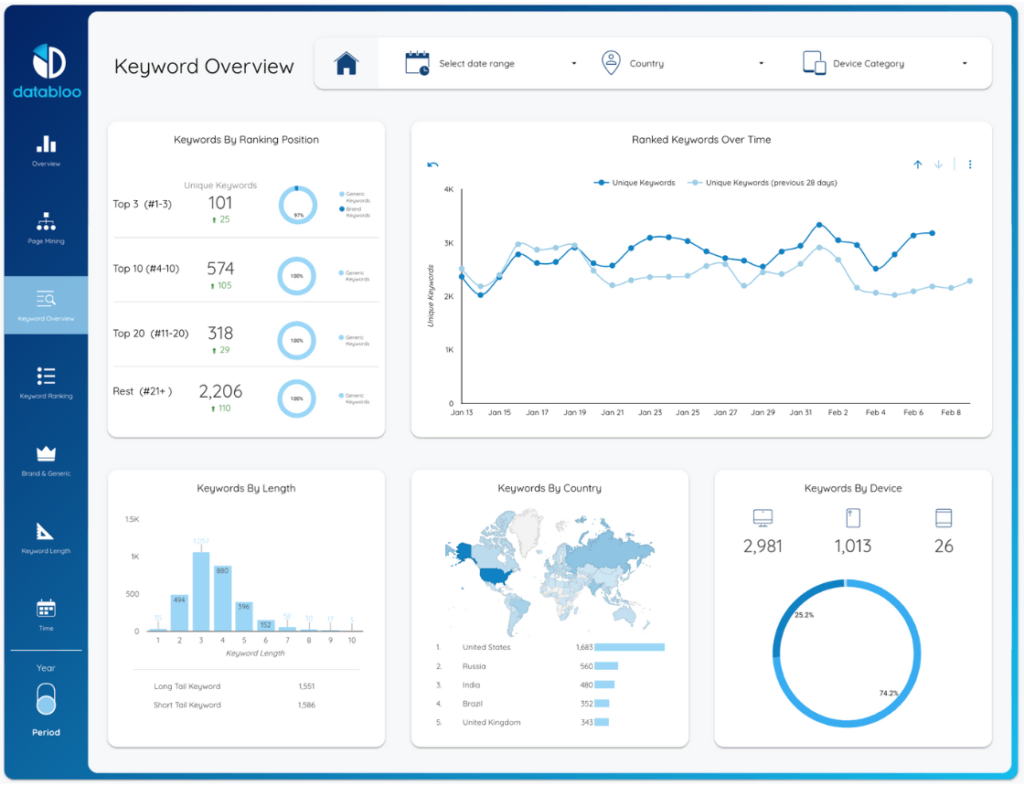
Keyword rankings report
Tracks the performance of targeted keywords in search engine rankings, highlighting gains, losses, and opportunities for optimization.
Keywords ranking reports will help answer questions:
- Which keywords have gained or lost rankings?
- What are the current positions of targeted keywords?
- Where are the opportunities for further optimization?
Example of keyword ranking report: Demo your account
Email Marketing Reports
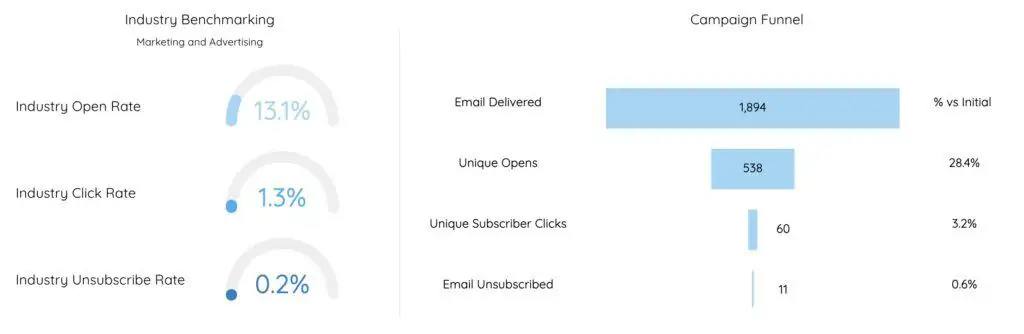
Campaign Performance Report
Measures the success of email campaigns by tracking open rates, click-through rates, and conversions to optimize strategies.
Campaign performance report answers these questions:
- How many recipients opened the email?
- What percentage of recipients clicked on links?
- What was the overall conversion rate?
Engagement Report
Evaluates subscriber interaction by analyzing metrics like engagement rates, optimal send times, and effective subject lines.
Email engagement report answers these questions:
- Which emails had the highest engagement?
- What time and day resulted in the highest open rates?
- Which subject lines were most effective?
List Health Report
Assesses the quality and activity level of the email list by tracking active subscribers, unsubscribe rates, and bounce rates.
Subscriber list health report answers these questions:
- How many subscribers are active or inactive?
- What are the unsubscribe and bounce rates?
- How effective are re-engagement strategies?
Advertising Reports
Campaign Performance Report
Measures the effectiveness of specific advertising campaigns (focus on specific platform e.g. Google Ads or Meta Ads, timeframe, or campaign) by tracking impressions, clicks, and conversions to refine strategies.
Campaign performance report answers these questions:
- How many impressions and clicks did the ads receive?
- What was the click-through rate (CTR)?
- What was the overall conversion rate?
ROI Report
Evaluates the return on investment by comparing ad spend to revenue generated.
ROI report answers these questions:
What is the total ad spend?
- How much revenue was generated from the ads?
- What is the return on ad spend (ROAS)?
Audience Insights Report
Useful for analyzing the demographics and behaviors of the target audience to optimize targeting.
Audience insights report answers these questions:
- What are the demographic characteristics of the audience?
- Which audience segments are most engaged?
- How does audience behavior vary across different ads?
Social Media Reports
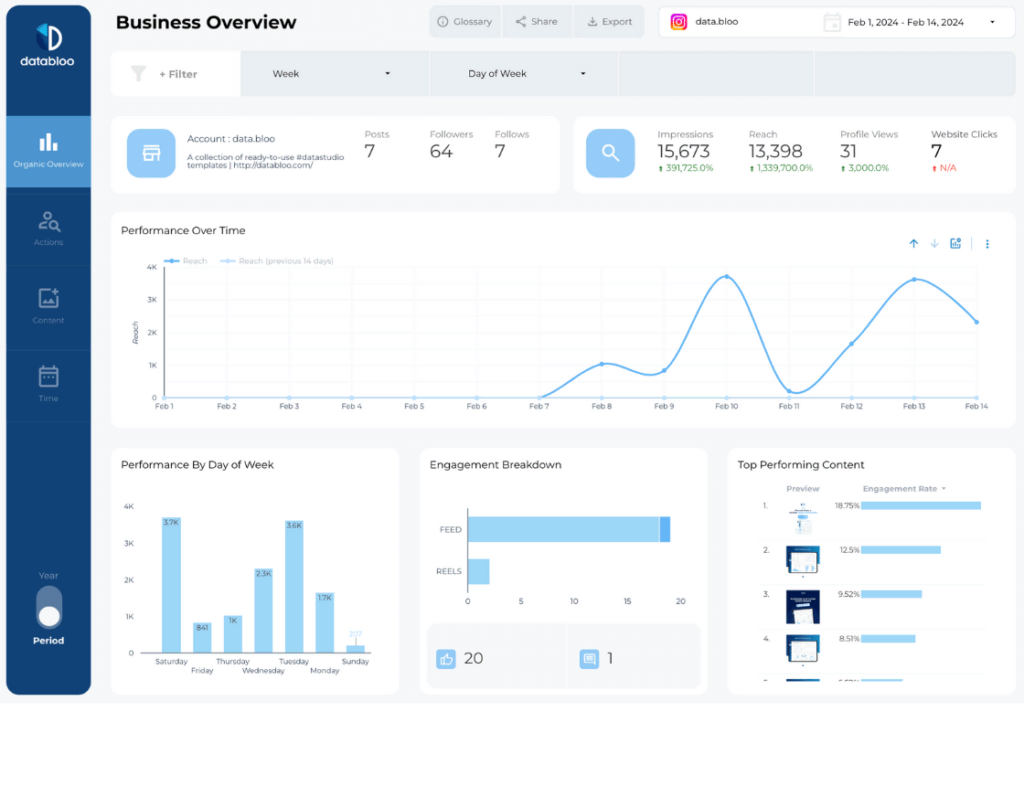
Channel Growth Report
Measures the increase in followers, likes, and overall engagement on social media channels to assess growth.
Channel growth report answers these questions:
- How many new followers were gained over the period?
- What is the growth rate of likes and shares?
- How does engagement compare to previous periods?
Example of Instagram Insights Report: View demo
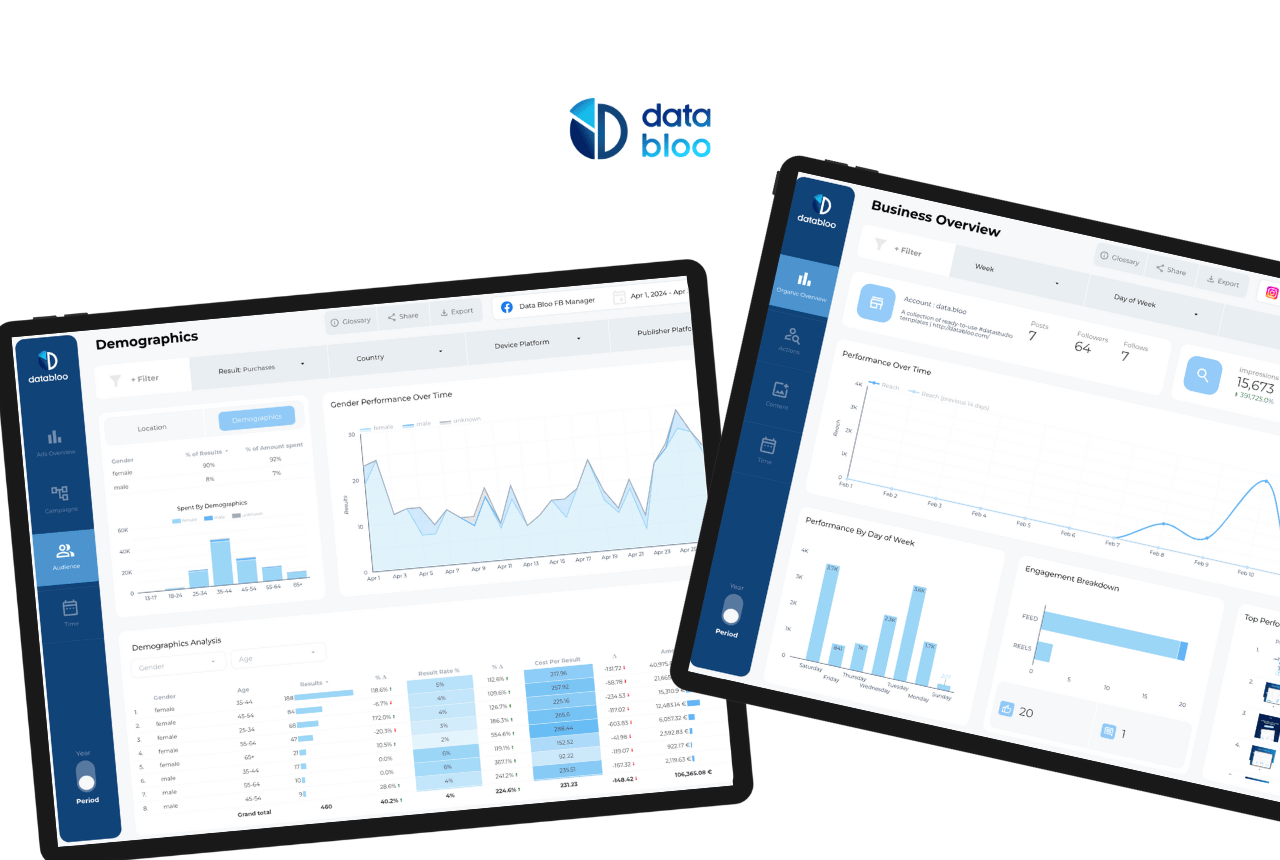
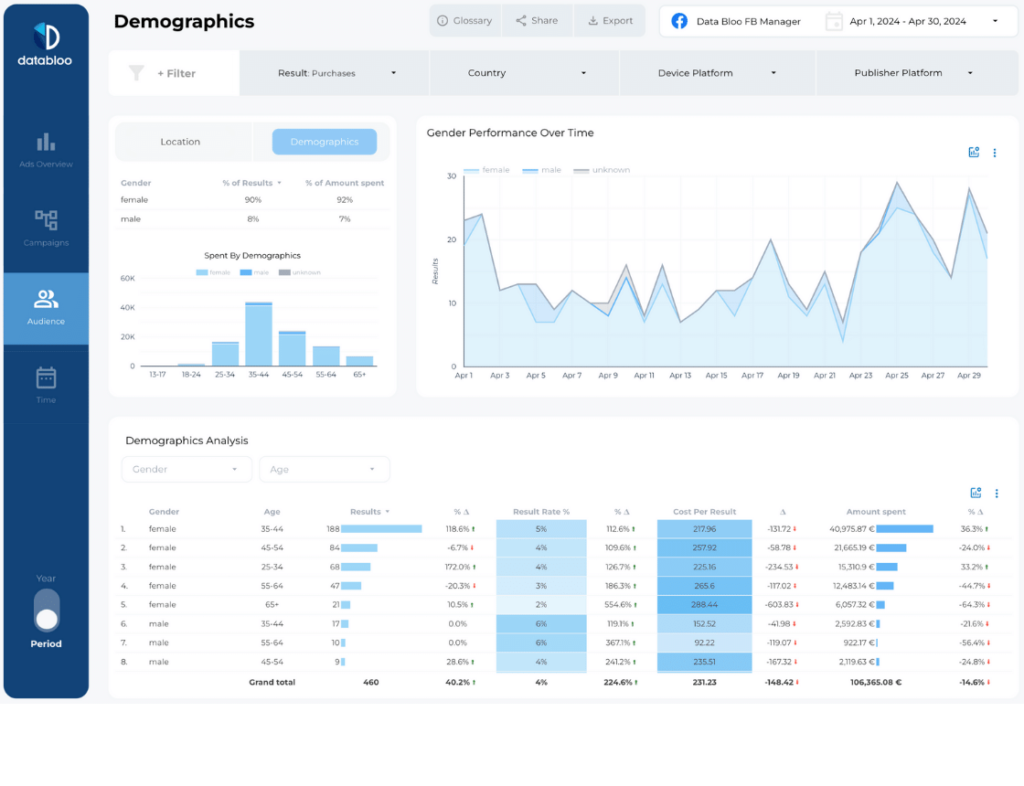
Audience Insights Report
Analyzes the demographics, interests, and behaviors of social media followers to optimize content and targeting.
Audience insights report answers these questions:
- What are the demographic characteristics of the audience?
- What content resonates most with the audience?
- How do different audience segments interact with the content?
Example of Facebook Ads Audience Report: View demo
Ecommerce Reports
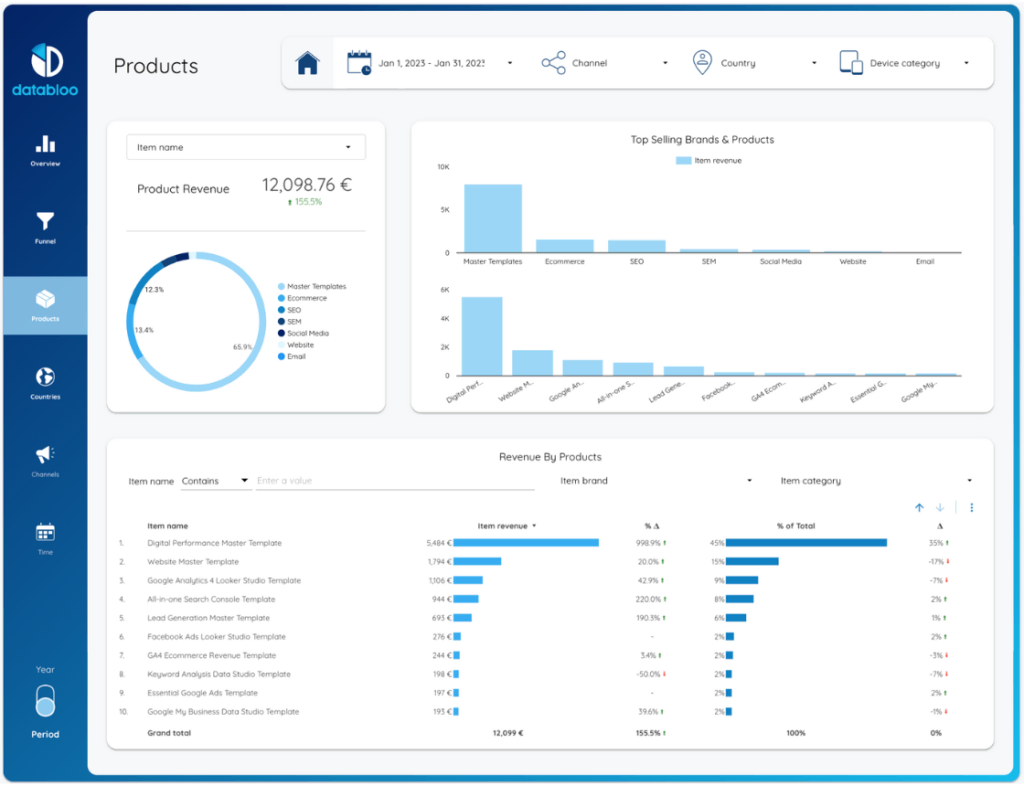
Sales Performance Report
Evaluates sales metrics to assess overall performance and identify trends.
Sales performance report answers these questions:
- What are the total sales and revenue figures?
- Which products are the top sellers?
- How do sales compare to previous periods?
Example of Ecommerce Revenue Report: Demo your account
Customer Insights Report
Analyzes customer behavior and demographics to improve targeting and retention.
Customer insights report answers these questions:
- Who are the main customer demographics?
- What are the purchase behaviors and trends?
- How effective are retention strategies?
Inventory Management Report
Tracks inventory levels and turnover to optimize stock and reduce costs.
Inventory management report answers these questions:
- What are the current inventory levels?
- Which products have the highest turnover rates?
- Are there any stock shortages or overages?
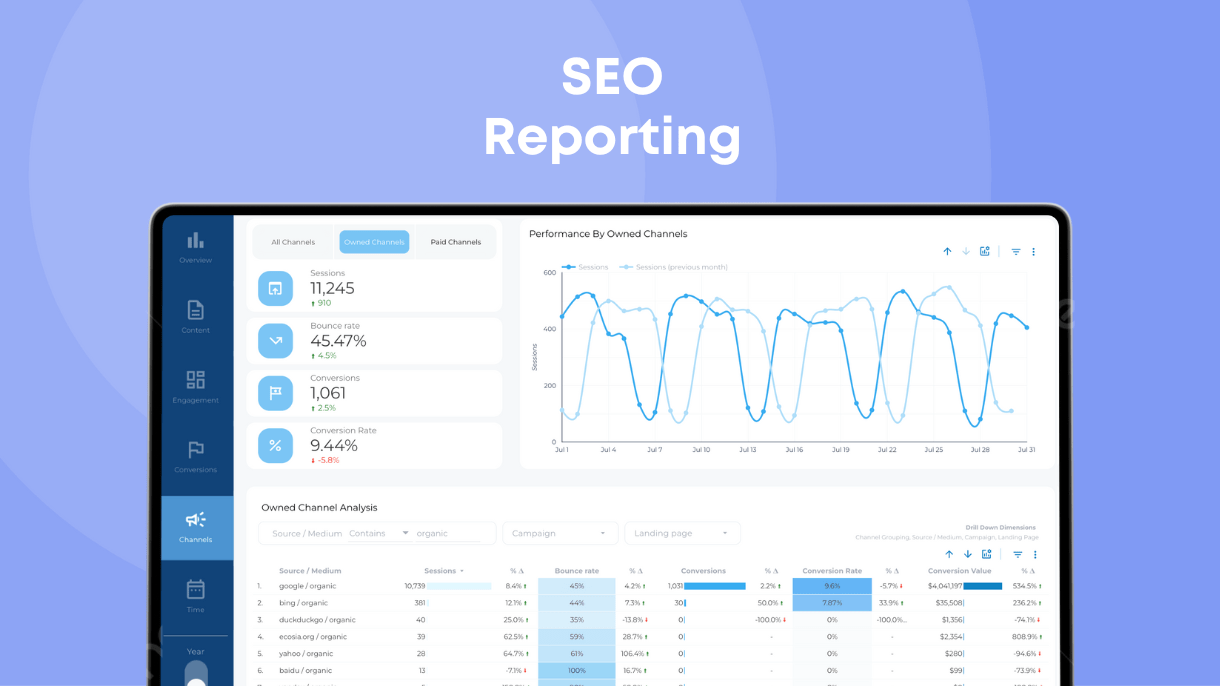
High-Level Marketing Overview Report
Provides a summary of performance across all marketing channels, highlighting key metrics and trends to inform strategic decisions, also known as marketing channel performance report. Has a few variations, for example specific channel reports or trends reports.
High-Level Marketing Overview Report answers these questions:
- How is each marketing channel performing overall?
- What are the key metrics and trends across channels?
- Which channels are driving the most traffic, leads, and conversions?
Channel Performance Report
- How does performance vary by channel (e.g., social media, email, PPC)?
- Which channels have the highest ROI?
- Where should resources be allocated for maximum impact?
Trend Analysis Report
- What are the emerging trends in marketing performance?
- How do current metrics compare to historical data?
- What strategic adjustments are needed based on trends?
Tips To Instantly Improve Your Marketing Reports
Checklist graphics
Visualize
Use charts, graphs, and infographics to make data easily understandable. Visual elements help convey complex information quickly and enhance engagement.
Considerations: Avoid cluttered visuals and overcomplicating graphs. Ensure clarity and simplicity.
Mind Hierarchy
Organize information logically with clear headings and subheadings. Prioritize data presentation either from high-level summaries to detailed breakdowns or from most to least important insights.
Considerations: Don’t overwhelm readers with too many levels. Maintain a clear and concise structure.
Avoid Too Much Data
Choose between presenting from high level to bottom level or by priority, based on what your audience needs to focus on.
Considerations: Avoid information overload. Focus on the most relevant and impactful data.
Think About Your Target Audience
Tailor your reports to the specific needs and preferences of your audience. Understand what metrics matter most to them and adjust the report’s focus accordingly.
Considerations: Don’t assume audience knowledge. Provide necessary context and explanations.
Automate Your Reports
Automate data collection and report generation to save time and reduce errors. Use tools that integrate with your data sources for seamless updates and consistency.
Considerations: Avoid over-reliance on automation. Regularly review and validate automated data to ensure accuracy.
Choose Optimal Frequency For Marketing Reporting
The optimal frequency for marketing reporting typically falls between weekly and quarterly, depending on the specific needs of your business. Increase report frequency when launching new campaigns, entering new markets, or when rapid feedback is essential. Decrease frequency in more stable periods or when resources need to be allocated to other critical tasks.
Factors to consider when choosing how often to report on marketing efforts:
- Business Goals. Align the frequency of reports with your strategic objectives.
- Market Dynamics. Consider the pace of change in your industry.
- Data Availability. Ensure data is available and reliable at the chosen intervals.
- Resource Allocation. Balance the frequency with the resources available for data collection and analysis.
Below are common intervals for marketing reporting with their advantages and disadvantages.
Weekly or Bi-Weekly Marketing Report
Types of Reports. Campaign performance updates, social media engagement, email marketing metrics.
Advantages. Provides quick insights into ongoing campaigns, allows for swift adjustments, keeps the team informed and agile.
Disadvantages. Can be resource-intensive, may lead to information overload, and might not capture long-term trends.
Monthly Marketing Report
Types of Reports. Overall performance reviews, SEO metrics, content marketing performance, most agency client reports.
Advantages. Strikes a balance between detail and manageability, captures medium-term trends, allows for more comprehensive analysis.
Disadvantages. May miss short-term fluctuations, requiring a monthly commitment of resources.
Quarterly Marketing Report
Types of Reports. Strategic reviews, ROI analysis, comprehensive market analysis.
Advantages. Provides a broader perspective on trends, aligns with quarterly business planning, less frequent resource allocation.
Disadvantages. Might overlook short-term issues, less frequent insights could delay necessary adjustments.
Yearly Marketing Report
Types of Reports. Annual performance reviews, market positioning, long-term strategic planning.
Advantages. Offers a comprehensive view of annual performance, aids in long-term strategic decisions, aligns with fiscal planning.
Disadvantages. Lack of timeliness, may be too infrequent for dynamic markets, can be overwhelming due to the volume of data.
Should You Customize Marketing Reports For Each Client
If you’re a marketing agency working with several clients, some form of customization is necessary and beneficial for both you and clients when creating marketing reports.
Using white label marketing reports allows you to feature agency logos, colors, and fonts to reinforce your brand identity, present a cohesive, professional image to your clients and foster strong connection with them.
Another form of customization is the ability to quickly rearrange information in marketing reports to tailor it to specific client needs.
For example, SEO reports for a news publisher who relies on articles to generate organic traffic will be more focused on top performing content and audience engagement metrics, whereas an e-commerce client will focus on product pages and conversions.
How to Create a Marketing Report: 3 Options
There are several ways to create a marketing report, such as:
- Using a marketing report template
- Some marketing tools have report exports
- Manual reporting using Excel and Google Documents
Tool Export
Many marketing tools offer some form of reporting. There are two main downsides here: 1) often you can’t customize reports to any degree because you are limited by the tool format 2) these reports focus only on a certain type of data. For example, a technical audit SEO tool report will focus only on website issues and won’t include data about keywords or conversions.
Manual Reporting
You can always use tools such as Google Spreadsheets or Excel to build custom marketing reports. In this case, the possibilities of customization are limitless as Spreadsheet and Excel support graphics, formulas, and filters.
The downside here is that these types of reports take a lot of time to build and need to be updated manually every time.
Use Looker Studio Templates
Using looker studio templates, you can quickly set up any marketing report that:
- Automatically updated – the report pulls and updates data from different sources (Google Analytics, Google Ads, social media tools, and so on)
- Can be customized to any degree (from adding your logo to editing whole layout or adding new sources)
- Easy to set up (you only need to log into to access data for the report)
Here’s an example of using Data Bloo template for an all-around SEO report that takes data from Google Search Console, Google Analytics, and Google Ads:
You can try a free demo here.
There are many different types of marketing reports available, including:
- SEO reports
- Ecommerce reports
- Paid Advertising reports
- Social Media reports
And more, You can check the full list of reports and try every report for free in one click.
Common Mistakes In Marketing Reporting
A few seemingly small mistakes can render a marketing report ineffective and misleading. Here’s what to watch out for.
1. Overlooking Data Quality
Failing to ensure data accuracy can lead to misguided decisions. Always verify data sources and cross-check for consistency to maintain reliable insights. This is especially fair for reports compiled manually or reports where you rely on 3rd party data a lot.
2. Ignoring Contextual Factors
Reports that neglect external influences like market trends or seasonal changes can mislead stakeholders. Include contextual analysis to provide a complete picture.
For example, an SEO traffic report that lacks insights into seasonal search trends within your industry might send mixed signals about SEO performance.
3. Overemphasizing Vanity Metrics
Focusing on metrics like social media likes instead of actionable KPIs can distort the true performance. Prioritize metrics that directly impact business goals.
4. Lack of Clear Goals
Reports without clearly defined objectives fail to deliver actionable insights. Set specific goals to measure progress and tailor reports to reflect these aims.
5. Poor Visualization
Complex data presented in confusing formats can hinder understanding. Use clear, concise visualizations to effectively communicate key findings and trends.